X
Categories
original research

Platypus Paper, Rewritten

This is a completely rewritten version of a biology paper titled, “A Model for the Evolution of the Mammalian T-cell Receptor α/δ and μ Loci Based on Evidence from the Duckbill Platypus.” It is meant to be a demonstration and a proof of concept for JAWWS, my idea of a science journal that focusses on readability.

You can read the original version on the Molecular Biology and Evolution journal’s website, or here on this blog, with annotations by me.

Why did I choose to rewrite this paper? I wish I had a more principled answer, but the truth is that I simply went to ResearchHub, a website where scientists share papers between themselves and upvote the most interesting one, went to the Evolutionary Biology section (because that used to be my field), and picked the first paper that was open-access and seemed fit for my purposes. In other words, a paper that seemed like it could be improved a lot because it seemed more difficult to understand than was warranted.

Only later did I realize it was a paper from 2012, so not that recent. I don’t think that matters too much for now since it’s just a proof of concept. Nor does the topic, i.e. molecular evolution in the vertebrate immune system. The actual journal will need to pick papers in a more principled way, of course.

What did my rewrite entail? The best way to know is to read (not necessarily closely) the original and rewritten versions. But here’s a sample of my “interventions”:

  • I put almost all citations in collapsible footnotes.
  • I cut up most long paragraphs, including the abstract.
  • I added many context sentences, including at the beginning of sections, to give a better sense of why we’re reading this. One example is the first sentence of the introduction: “How did the immune system of jawed vertebrates evolve?”
  • I reworked some of the paper’s structure. One major change: I put the major contribution of the study, that is, the new evolutionary model, in its own section after the introduction. This way, it is not buried deep in the discussion; readers can start with it and dig into the rest only if they want more details. I also reordered the methods so that they would match the ordering in the Results.
  • I added several subheadings to the sections that didn’t already have subsections (Introduction, and Results and Discussion)
  • I tried my best to avoid abbreviations. One difficulty is that some of them are probably very recognizable by people who  know immunology, and not by me. So I left some in, while trying to make sure they don’t hamper readability. The major example is “TCR”, which means T-cell receptor and was used a lot. It’s still used in my version, but far less often.
  • I removed some jargon words. E.g. “proximal” became “closest”.
  • I formatted some information in point form, such as the T-cell lineages or the protocols in the Methods.
  • I added some text formatting to guide the reader. For instance, bold font for groups of animals in the introduction, and color in the text to match colored elements in figures.
  • I changed one figure by reorganizing its parts to make it clearer (fig. 2, which used to be fig. 5). A lot of additional clarity could potentially be gained from editing the figures, but that’s a lot of work, so I didn’t press it further.
  • I fixed a number of typos and grammatical errors. Mistakes like this are not a big problem, but there were enough that I assume little editing work was done on this paper.

On footnotes: I’m using two different kinds of collapsible footnotes. Those in the usual style of the blog, like this one,1Here you would usually read a citation in short form such as “Rast et al. 1997.” Head to the original paper webpage to see the reference list in full. contain the citations included in the original paper.  Footnotes with brackets like this[1]This is an example comment. are for comments on the rewriting process and are also shown at the bottom of the paper. I suggest you don’t click on the former, unless you want to see a reference, and hover onto the latter to read my comments.

Overall, my rewrite increased the length of the abstract from 267 to 286 words, and of the rest of the paper from about 6000 to about 6400 words. I consider this acceptable.

I will publish some more thoughts on the rewriting process later.

Abstract

Goal: This study presents a new model for the evolution of part of the vertebrate immune system: the genes encoding the T-cell receptor (TCR) δ chains.

Background: T lymphocytes have to recognize specific antigen for the adaptive immune response to work in vertebrates. They perform this using a somatically diversified T-cell receptor. All jawed vertebrates use four T-cell receptor chains called α, β, γ, and δ, but some lineages have nonconventional receptor chains: monotremes and marsupials encode a fifth one, called TCRµ. Its function is unknown, but it is somatically diversified like the conventional chains. Its origins are also unclear. It appears to be distantly related to the TCRδ chain, for which recent evidence from birds and frogs has provided new information that was not available from humans or other placental (eutherian) mammals.

Experiment: We analyzed the genes encoding the δ chains in the platypus. This revealed the presence of a highly divergent variable (V) gene, indistinguishable from immunoglobulin heavy chain V genes (VH), and related to V genes used in the µ chain. This gene is expressed as part of TCRδ repertoire, so it is designated VHδ.

Conclusions: The VHδ gene is similar to what has been found in frogs and birds, but it is the first time such a gene has been found in a mammal. This provides a critical link in reconstructing the evolutionary history of TCRµ. The current structure of the δ and µ genes in tetrapods suggests ancient and possibly recurring translocations of gene segments between the δ and immunoglobulin heavy genes, as well as translocations of δ genes out of the TCRα/δ locus early in mammals, creating the TCRµ locus. We present a detailed model of this evolutionary history.[2]Major changes to the abstract: I split it in four paragraphs with section titles (this is common in some journals; it should be common in most journals). I also added a section at the beginning to … Continue reading

Introduction

How did the immune system of jawed vertebrates evolve? In this study, we use genomic evidence from the platypus to propose a model for the evolution of a specific component of the vertebrate immune system: the receptors on the surface of T lymphocytes.

As a reminder, T lymphocytes (or T cells) are white blood cells that play a critical role in the adaptive immune system. They can be classified into two main lineages based on the receptor they use:2Rast et al. 1997; reviewed in Davis and Chein 2008

  1. αβT cell lineage: The receptor is composed of a heterodimer of α and β chains. Most circulating human T cells are αβT cells, including familiar subsets such as CD4+ helper T cells and regulatory T cells, CD8+ cytotoxic T cells, and natural killer T (NKT) cells.
  2. γδT cell lineage: The receptor is composed of γ and δ chains. The function of these cells is less well defined. They have been associated with a broad range of immune responses including tumor surveillance, innate responses to pathogens and stress, and wound healing.3Hayday 2009 γδT cells are found primarily in epithelial tissues and form a lower percentage of circulating lymphocytes in some species.

αβ and γδ T cells also differ in the way they interact with antigen. The receptors of αβT cells are “restricted” relative to the major histocompatibility complex (MHC), meaning that that they bind antigenic epitopes, such as peptide fragments, bound to, or “presented” by, molecules encoded in the MHC. In contrast, γδT receptors have been found to bind antigens directly in the absence of MHC, as well as self-ligands that are often MHC-related molecules.4Sciammas et al. 1994; Hayday 2009

All gnathostomes (jawed vertebrates) have αβ and γδ T cells. As we will see below, marsupial and monotreme mammals have an additional type of T-cell receptor, denoted with the letter µ. The platypus, a monotreme, further has a non-conventional receptor with δ chains, which is also present in birds and amphibians.

Before presenting our evolutionary model, let’s review these types of T-cell receptors and their structure.

Structure and Genes of Conventional T-Cell Receptors

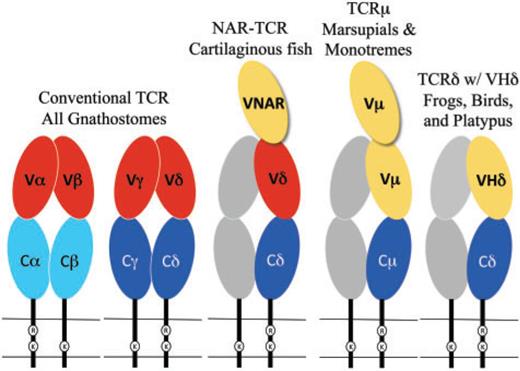
The chains of conventional T-cell receptors are composed of two extracellular domains, both members of the immunoglobulin domain superfamily of cell surface proteins (fig. 1):5reviewed in Davis and Chein 2008

  • The closest domain to the cellular membrane is called C for constant.[3]Since this abbreviation comes up a lot, I put it first, with its meaning in parentheses. The C domain is largely invariant among T-cell clones expressing the same class of the receptor chain.
  • The domain farthest from the cellular membrane is called V for variable. It is the region that contacts antigen and MHC. Similar to antibodies, the individual clonal diversity in the V domain is generated by somatic DNA recombination.6Tonegawa 1983 [4]I didn’t change much in the figure’s caption, but it seemed pretty trivial to add color to the text to facilitate looking up what the colors mean.
Fig. 1. Cartoon diagram of the T-cell receptor (TCR) forms found in different species. Oblong circles indicate immunoglobulin superfamily domains and are color coded as C domains (blue), conventional V domains (red), and VHδ or Vµ (yellow). The gray shaded chains represent the hypothetical partner chain for µ and δ using VHδ.

While C domains are usually encoded by a single, intact exon, V domains are assembled somatically from germ-line segments in developing T cells. These segments are genes called V (again for variable), D (for diversity), and J (for joining). The assembly process depends on the enzymes encoded by two genes, the recombination activating genes (RAG)-1 and RAG-2.7Yancopoulos et al. 1986; Schatz et al. 1989

The various T-cell receptor chains differ in how their V domains are assembled. β and δ chains are assembled from all three types of gene segments, whereas α and γ chains use only V and J. The different combinations of two or three segments, selected from a large repertoire of germ-line gene segments, along with variation at the junctions due to the addition and deletion of nucleotides during recombination, contribute to a vast diversity of T-cell receptors. It is this diversity that creates the individual antigen specificity of T-cell clones.[5]This is an example of two sentences taken verbatim from the original paper. Not all of it was poorly written!

These genes are highly conserved among species in both their genomic sequence and their organization.8Rast et al. 1997; Parra et al. 2008, 2012; Chen et al. 2009 In all tetrapods examined, the β and γ chains are each encoded at multiple separate loci, whereas the genes encoding the α and δ chains are nested at a single locus, called the TCRα/δ locus.9Chien et al. 1987; Satyanarayana et al. 1988; reviewed in Davis and Chein 2008 The V domains of α and δ chains can use a common pool of V gene segments, but distinct D, J, and C genes.

The recombination of V, J and optionally D genes, referred to as V(D)J recombination, and mediated by RAG, is also known to generate the diversity of antibodies produced by another type of lymphocyte, the B cells.[6]It took me forever to rewrite this part. The original sentence was, “Diversity in antibodies produced by B cells is also generated by RAG-mediated V(D)J recombination and the TCR and Ig genes … Continue reading10Flajnik and Kasahara 2010; Litman et al. 2010

Non-Conventional Receptors Across Vertebrates

T-cell receptor and immunoglobulin genes clearly share a common origin in the jawed vertebrates.11Flajnik and Kasahara 2010; Litman et al. 2010 Usually, the V, D, J, and C coding regions are readily distinguishable from immunoglobulin, at least for conventional T-cell receptors, owing to divergence over the past 400 million years.

Recently, however, the discovery of non-conventional isoforms of the δ chain has blurred the boundary between them. These non-conventional forms use V genes that appear indistinguishable from the immunoglobulin heavy chain V.12Parra et al. 2010, 2012 Such V genes have been named VHδ.[7]The original combined this sentence and the next, even though they’re about quite distinct ideas: the name of the genes, and the species where they’re found.

VHδ genes have been found in both amphibians and birds (see the rightmost part of fig. 1).[8]Why not indicate the part of the figure that is relevant? Whenever you can, provide reader guidance! In the frog Xenopus tropicalis, as well as in a passerine bird, the zebra finch Taeniopygia guttata, the VHδ genes coexist with the conventional Vα and Vδ genes at the TCRα/δ locus.13Parra et al. 2010, 2012

In galliform birds, such as the chicken Gallus gallus, they are instead located at a second TCRδ locus that is unlinked to the conventional TCRα/δ.14Parra et al. 2012 VHδ are the only type of V gene segment present at the second locus and, although closely related to antibody VH genes, the VHδ appear to be used exclusively in δ chains. This is true as well for frogs where the TCRα/δ and IgH (immunoglobulin heavy chain) loci are tightly linked.15Parra et al. 2010

In mammals, a TCRα/δ locus has been characterized in several eutherian species and at least one marsupial, the opossum Monodelphis domestica. VHδ genes have not been found in mammals to date.16Satyanarayana et al.1988; Wang et al. 1994; Parra et al. 2008 However, marsupials do have an additional locus, unlinked to TCRα/δ, that uses antibody-related V genes. This fifth chain is called µ, and the receptor that uses it is referred to as TCRµ. The µ chain is related to the δ chain, but it diverges from it in both sequence and structure.17Parra et al. 2007, 2008 It has also been found in a monotreme, the platypus.[9]The authors like to use “duckbill platypus,” but there’s only one species of platypus, so I took that word out. The platypus and marsupial TCRµ genes are clearly orthologous, which is consistent with the idea that the µ chain is ancient in mammals, but has been lost in the eutherians.18Parra et al. 2008; Wang et al. 2011

TCRµ chains use their own unique set of V genes, called Vµ.19Parra et al. 2007; Wang et al. 2011 So far, no evidence has been found of V(D)J recombination between Vµ genes and genes from other immunoglobulin or T-cell receptor loci.[10]Another horrible sentence from the original, recorded for posterity: “Trans-locus V(D)J recombination of V genes from other Ig and TCR loci with TCRµ genes has not been found.” That … Continue reading  Neither have TCRµ homologues been found in non-mammals.20Parra et al. 2008

The structure of TCRµ chains is atypical. They contain three, rather than two, extra-cellular domains from the immunoglobulin superfamily;[11]The abbreviation IgSF was used in the paper, with no explanation. I assume the people who would read this paper tend to know what that means, but still. this is due to an extra N-terminal V domain (see fig. 1).21Parra et al. 2007; Wang et al. 2011 Both V domains are encoded by a unique set of Vµ genes and are more related to immunoglobulin heavy chain V than to conventional T-cell receptor V domains. The N-terminal one is diverse and encoded by genes that undergo somatic V(D)J recombination, while the second V domain (referred to as “supporting”) has little or no diversity.

The supporting V domain differs between marsupials and monotremes. In marsupials, it is encoded by a germ-line joined, or pre-assembled, V exon that is invariant.22Parra et al. 2007 In the platypus, it is encoded by gene segments requiring somatic DNA recombination, but with limited diversity due in part to the lack of D segments.23Wang et al. 2011

Sharks and other cartilaginous fish also have a T-cell receptor chain that is structurally similar to TCRµ (see middle part of fig. 1).24Criscitiello et al. 2006; Flajnik et al. 2011 The resulting receptor is called NAR-TCR. Like the receptor of marsupials and monotremes, it contains three extracellular domains, but its N-terminal V domain is related to chains used by IgNAR (immunoglobulin new antigen receptor) antibodies, a type of antibody found only in sharks.25Greenberg et al. 1995 In both the TCRµ of marsupials and monotremes and the NAR-TCR of cartilaginous fishes, the current working model is that the N-terminal V domain is unpaired and acts as a single, antigen binding domain. This would be analogous to the V domains of light-chainless antibodies found in sharks and camelids.26Flajnik et al. 2011; Wang et al. 2011

How did the µ chain arise? Phylogenetic analyses support an origin after the avian–mammalian split.27Parra et al. 2007; Wang et al. 2011 Previously, we hypothesized that it originated as a recombination between ancestral immunoglobulin heavy and TCRδ-like loci,28Parra et al. 2008 but this hypothesis is problematic for several reasons. One challenge is the apparent genomic stability and ancient conserved synteny (order of genes on the chromosome) in the region surrounding the TCRα/δ locus; this region has appeared to remain stable over at least the past 350 million years of tetrapod evolution.29Parra et al. 2008, 2010

As a result, we need a new model for the evolution of TCRµ and the TCRα/δ locus. Here we present the best current model, supported by an analysis of the platypus genome—the first to examine a monotreme TCRα/δ locus in detail—as described in the methods and results sections below.

The Model

Our model can be summarized in six stages (fig. 2).[12]Major change from me here. This section was moved here from the discussion, because it is the core and most interesting part of the paper. It is now its own first-level section alongside … Continue reading

Fig. 2. A model of the stages of evolution of the TCRα/δ loci in tetrapods and the origins of TCRµ in mammals. Refer to the text for detailed explanation of stages A-F.
  1. Duplication of the cluster. This occurred early in the evolution of tetrapods, or earlier. The duplication resulted in two copies of the C gene of the δ chain, each with its own set of D and J segments.

  2. Insertion of VH. Recall that VH refers to the variable chain of immunoglobulin heavy (IgH). One or more genes were translocated from the IgH locus and inserted into the TCRα/δ locus, most likely to a location between the existing Vα/δ genes and the 5′-proximal cluster. This is the configuration found today in the zebra finch genome.30Parra et al. 2012

  3. Inversion of the VHδcluster in amphibians. This cluster of genes was translocated and inverted, and the number of VHδ genes increased. The frog X. tropicalis currently has the greatest number of VHδ genes, where they make up the majority of V genes available in the germ-line for T-cell receptor δ chains.31Parra et al. 2010

  4. Translocation of the VHδcluster to another site in galliforms. In chickens and turkeys, the same cluster that was inverted in amphibians instead moved out of the TCRα/δ locus and is now found on another chromosome. There are no or genes at this second TCRδ locus in chickens, and only a single gene remains at the conventional TCRα/δ locus.32Parra et al. 2012

  5. Translocation of the VHδcluster to another site (TCRµ) in mammals. A similar process to step D in galliforms happened in a common ancestor of mammals, giving rise to TCRµ. Internal duplications of the VH, D, and J genes gave rise to the current [(VDJ) − (VDJ) − C] organization that can encode chains with double V domains.33Parra et al. 2007, Wang et al. 2011

  6. Further changes in the three mammalian lineages. 

    • In the platypus, the second VDJ cluster, which encodes the supporting (non-terminal) V chain, lost its D segments and generates V domains with short complementarity-determining region-3 (CDR3) encoded by direct V to J recombination.34Wang et al. 2011

    • Meanwhile, in therians (marsupials and placentals), the VHδ gene disappeared from the TCRα/δ locus (not shown in fig. 2).35Parra et al. 2008

    • Then, in placentals, the TCRµ locus was also lost.36Parra et al. 2008

    • The marsupials kept TCRµ, but the second set of V and J segments (which encode the supporting V domain) was replaced with a germ-line joined V gene (fused yellowgreen segment in fig. 2), probably due to germ-line V(D)J recombination and retro-transposition.37Parra et al. 2007, 2008

    • In both monotremes and marsupials, the whole cluster from VH to C appears to have undergone additional tandem duplication as it exists in multiple copies in the opossum and probably in the platypus.38Parra et al. 2007, 2008; Wang et al. 2011

The rest of the paper explains the analyses that gave us with the evidence to build this model. Additional discussion of the model is provided in the last section.

Materials and Methods

There are three parts to the analyses and experiments that allowed us to gather evidence and build our evolutionary model. First, find the TCRα/δ locus in platypus genome data. Second, perform phylogenetic analyses with the relevant genes. Third, confirm from a live specimen that the platypus expresses VHδ.[13]This new paragraph is important! It gives context to the experiments below and it guides the reader for the entire section. Also notice this is a case of an enumeration without point form. I like … Continue reading

1) Identification and Annotation of the Platypus TCRα/δ Locus

We analyzed the genome of the platypus, Ornithorhynchus anatinus, using the assembly version 5.0.1 (http://www.ncbi.nlm.nih.gov/genome/guide/platypus/). We used two genome alignment tools: whole-genome BLAST from NCBI (www.ncbi.nlm.nih.gov/) and BLAST/BLAT from Ensembl (www.ensembl.org).

We located the V and J gene segments by looking for similarity with the corresponding segments of other species, and by identifying flanking conserved recombination signal sequences. (RSS). We annotated V segments in the 5′ to 3′ direction as either Vα or Vδ, followed by the family number and the gene segment number if there were more than one in the family. For example, Vα15.7 is the seventh Vα gene in family 15.

As for the D segments, we identified them from cDNA clones using VHδ, using complementarity-determining region-3 (CDR3) sequences that represent the V-D-J junctions.

We labeled the platypus T-cell receptor gene segments according to the IMGT nomenclature (http://www.imgt.org/). We provide the location for the TCRα/δ genes of the platypus genome version 5.0.1 in supplementary table S1, available online.

2) Phylogenetic Analyses

We used BioEdit39Hall 1999 as well as the accessory application ClustalX40Thompson et al. 1997 to align the nucleotide sequences of the V genes regions, from the framework region FR1 to FR3, including the complementarity-determining regions CDR1 and CDR2. We established the codon position of the alignments using amino acid sequences.41Hall 1999 When necessary, we corrected the alignments through visual inspection. We then analyzed them with MEGA Software.42Kumar et al. 2004

We generated phylogenetic trees using two methods: Neighbor Joining (NJ) with uncorrected nucleotide differences (p-distance), and Minimum Evolution distances.

We evaluated support for the generated trees using bootstrap values from 1000 replicates. Supplementary table S2 contains the GenBank accession numbers for the sequences used in tree construction.[14]In the original paper, this section comes after the Confirmation of Expression section below, but in the results section, the phylogenetic results are discussed first. I don’t know if there was … Continue reading

3) Confirmation of Expression of Platypus VHδ

As described with more detail in the Results and Discussion section below, the annotation step allowed us to find an atypical VHδ gene in the platypus genome. To confirm that it was not an artifact of the genome assembly process, we looked at the expression of this gene in a live specimen, a male platypus from the Upper Barnard River in New South Wales, Australia. The platypus was collected under the same permits as in Warren et al. 2008.

We performed reverse transcription PCR (RT-PCR) on the RNA from the spleen of this New South Wales specimen. As a second point of comparison, we also used a previously described platypus spleen cDNA library that was constructed from RNA extracted from a Tasmanian animal.43Vernersson et al. 2002 The protocols and products used at every step are as follows:

  • cDNA synthesis: Invitrogen Superscript III-first strand synthesis kit, using the manufacturer’s recommended protocol44Invitrogen, Carlsbad, CA, USA
  • PCR amplification: we used the QIAGEN HotStar HiFidelity Polymerase Kit45BD Biosciences, CLONTECH Laboratories, Palo Alto, CA, USA in total volume of 20 µl containing:
    • 1× Hotstar Hifi PCR Buffer (containing 0.3 mM dNTPs)
    • 1µM of primers: we identified these from the platypus genome assembly step.46Warren et al. 2008 We targeted T-cell receptor δ transcripts with two primers, one for VHδ and one for Cδ:
        • 5′-GTACCGCCAACCACCAGGGAAAG-3′ for VHδ
        • 5′-CAGTTCACTGCTCCATCGCTTTCA-3′ for Cδ
    • 1.25U Hotstar Hifidelity DNA polymerase
  • PCR product cloning: TopoTA cloning® kit 47Invitrogen
  • Sequencing: BigDye terminator cycle sequencing kit version 348Applied Biosystems, Foster City, CA, USA according to the manufacturer recommendations.
  • Analysis of sequencing reactions: ABI Prism 3100 DNA automated sequences.49PerkinElmer Life and Analytical Sciences, Wellesley, MA, USA
  • Chromatogram analysis: Sequencher 4.9 software50Gene Codes Corporation, Ann Arbor, MI, USA

We archived the sequence on GenBank under the accession numbers JQ664690–JQ664710.

Results and Discussion

Results of the TCRα/δ Locus Identification in the Platypus

Here are the results of our analysis of the platypus genome from part 1 of the Materials and Methods section, which allowed us to identify the TCRα/δ locus and annotate its V, D, J and C gene segments, as well as the exons. Refer to fig. 3 below for the annotation map.

Fig. 3. Annotated map of the platypus TCRα/δ locus, showing the locations of the Vα and Vδ (red), VHδ (yellow), Dδ (orange), Jα and Jδ (green), Cδ (dark blue), and Cα (light blue). Conserved syntenic genes are in gray. The scaffold and contig numbers are indicated.

Most of the locus is present on a single scaffold. The remainder is on a shorter contig. On either sides of the locus, we find the genes SALL2, DAD1, and several olfactory receptor genes (OR). All of these genes share conserved synteny with the TCRα/δ locus in amphibians, birds, and mammals.51Parra et al. 2008, 2010, 2012

The platypus locus has many typical features common to TCRα/δ loci in other tetrapods.52Satyanarayana et al. 1988; Wang et al. 1994; Parra et al. 2008, 2010, 2012 Two C region genes are present: a Cα (light blue in fig. 3) at the 3′ end of the locus, and a Cδ (dark blue) oriented 5′ of the Jα genes. These Jα genes occur in a large number (32) of fragments (in green) located between Cδ and Cα. A large array of Jα genes like this is believed to facilitate secondary Vα to Jα rearrangements in developing αβT cells if the primary rearrangements are nonproductive or need replacement.53Hawwari and Krangel 2007 Primary TCRα V–J rearrangements generally use Jα segments towards the 5′-end of the array and can progressively use downstream Jα in subsequent rearrangements. There is also a single Vδ gene (the last red segment in fig. 3) in reverse transcriptional orientation between the platypus Cδ gene and the Jα array that is conserved in mammalian TCRα/δ both in location and orientation.54Parra et al. 2008

There are 99 conventional T-cell receptor V gene segments in the platypus TCRα/δ locus (red in fig. 3). The vast majority, 89, share nucleotide identity with Vα in other species; the other 10 share identity with Vδ genes. The Vδ genes are clustered towards the 3′-end of the locus. Based on nucleotide identity shared among the platypus V genes, they can be classified into 17 different Vα families and two different Vδ families, based on the criteria of a V family sharing >80% nucleotide identity (the family and segment numbers are annotated in fig. 3). This is a typical level of complexity for mammalian Vα and Vδ genes.55Giudicelli et al. 2005; Parra et al. 2008

Also present were two Dδ (orange) and seven Jδ (green) gene segments oriented upstream of the Cδ. All gene segments were flanked by canonical recombination signal sequences (RSS), which are the recognition substrate of the RAG recombinase. The D segments were asymmetrically flanked by an RSS containing at 12 bp spacer on the 5′-side and 23 bp spacer on the 3′-side, as has been shown previously for T-cell receptor D gene segments in other species.56Carroll et al. 1993; Parra et al. 2007, 2010 In summary, the overall content and organization of the platypus TCRα/δ locus appeared fairly generic, with one exception.

This atypical feature of the platypus locus is an additional V gene that shares greater identity to antibody VH genes than to T-cell receptor V genes. Among V genes, this segment is the closest to the D and J genes (see the yellow segment in fig. 3). We tentatively designated it as VHδ. 

VHδ Phylogenetics

VHδ genes are, by definition, V genes that are indistinguishable from immunoglobulin heavy V (Ig VH) genes, but used in encoding T-cell receptor δ chains. Recall from the introduction[15]Yes, you are allowed to make links between the sections of your paper like this! that they have previously been found only in the genomes of birds and frogs.57Parra et al. 2008, 2010, 2012

To put the platypus VHδ gene in context, let us examine the phylogeny of VH genes. In mammals and other tetrapods, VH genes have been shown to cluster into three ancient clans (shown in fig. 4). Individual species differ in the presence of one or more of these clans in their germ-line immunoglobulin heavy locus.58Tutter and Riblet 1989; Ota and Nei 1994 For example, humans, mice, echidnas, and frogs have VH genes from all three clans,59Schwager et al. 1989; Ota and Nei 1994; Belov and Hellman 2003 whereas rabbits, opossums, and chickens have only a single clan.60McCormack et al. 1991; Butler 1997; Johansson et al. 2002; Baker et al. 2005

Fig. 4. Phylogenetic tree of mammalian VH genes, including the platypus VHδ and monotreme Vµ. The three major VH clans are bracketed. A box indicates the platypus VHδ, and bolding indicates the clade containing platypus VHδ along with platypus and echidna Vµ within clan III. The three-digit numbers following the VH gene labels are the last three digits of the GenBank accession number referenced in supplementary table S2. The numbers following the platypus and echidna Vµ labels are clone numbers. The tree shown here was generated using the Minimum Evolution method; the Neighbor Joining method yielded a similar topology.

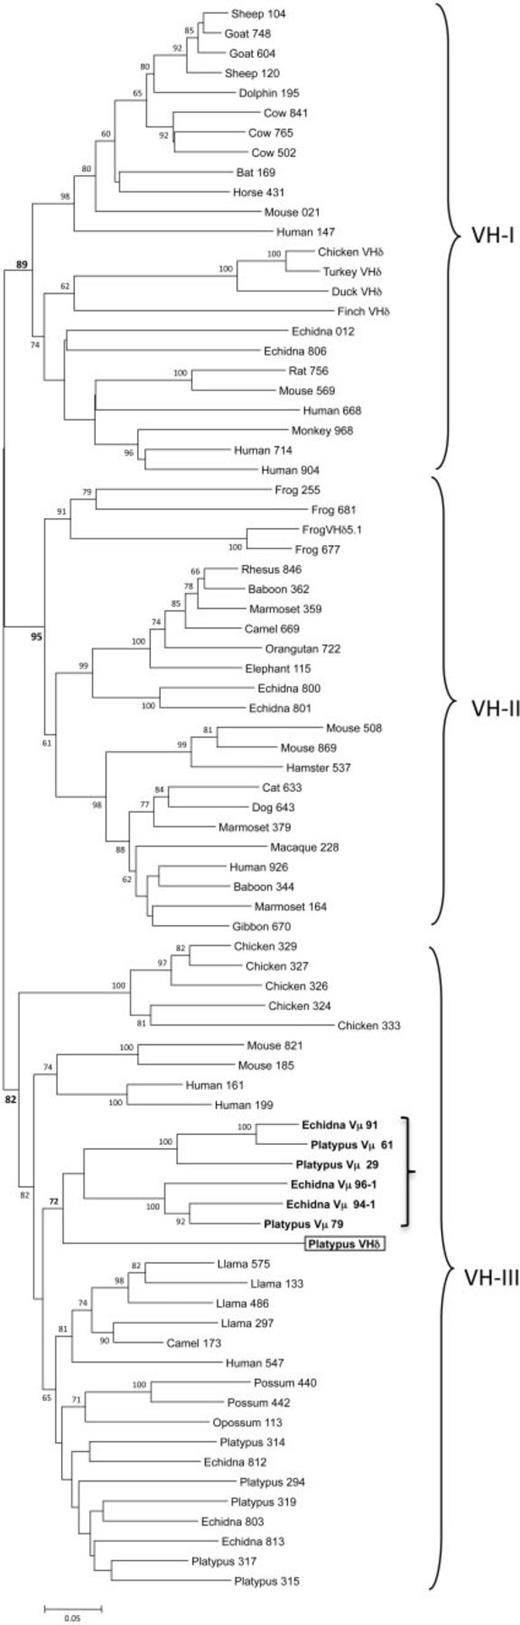
Our phylogenetic analyses showed that the platypus VHδ was most related to the platypus Vµ genes found at the TCRµ locus (see the boxed and bolded parts of fig. 4). Platypus VHδ, however, shares only 51–61% nucleotide identity (average 56.6%) with the platypus Vµ genes. Both the platypus Vµ and VHδ clustered within clan III.61Wang et al. 2011 This is noteworthy since VH genes in the platypus IgH locus are also from clan III and, in general, clan III is the most ubiquitous and conserved lineage of VH.62Johansson et al. 2002; Tutter and Riblet 1989 Although clearly related to platypus VH, the VHδ gene shares only 34–65% nucleotide identity (average 56.9%) with the “authentic”[16]I’m not sure about this but the original phrase was bona fide, which I had to look up. Maybe “authentic” between quotes isn’t the best translation, but a translation is better … Continue reading VH used in antibody heavy chains in this species.

Results of the Confirmation of VHδ Expression

It was necessary to rule out that the VHδ gene present in the platypus TCRα/δ locus was not an artifact of the genome assembly process. This is why we performed a “wet lab” verification step on cDNA synthesized from the splenic RNA of two platypuses, one from New South Wales and one from Tasmania (see Materials and Methods). We performed RT-PCR with primers that were specific for VHδ and Cδ. We were successful in amplifying the PCR products of the NSW specimen, but not for the Tasmanian one.

One piece of supporting evidence for the expression of VHδ would be the demonstration that it is recombined to downstream Dδ and Jδ segments, and expressed with Cδ in complete T-cell receptor δ transcripts. This is what we found from the twenty sequenced clones we obtained from PCR in the New South Wales platypus. Each clone contained a unique nucleotide sequence that comprised the VHδ gene recombined to the Dδ and Jδ gene segments (see fig. 4A). Of these 20, 11 had unique V, D, and J combinations that would therefore encode 11 different complementarity-determining regions-3 (CDR3; see fig. 4B). More then half of these (8 out of 11) contained evidence of using both D genes, giving a VDDJ pattern. This is a common feature of δ V domains where multiple D genes can be incorporated into the recombination due to the presence of asymmetrical RSS.63Carroll et al. 1993

Fig. 4. (A) Alignment of predicted protein sequence of transcripts containing a recombined VHδ gene isolated from platypus spleen RNA. The individual clones are identified by the last three digits of their GenBank accession numbers (JQ664690–JQ664710). Shown is the region from FR3 of the VHδ through the beginning of the Cδ domain. The sequence in bold at the top of the alignment is the germ-line VHδ and Cδ gene sequence. The double cysteines at the end of FR3 and unpaired cysteines in CDR3 are shaded, as is the canonical FGXG in FR4. (B) Nucleotide sequence of the CDR3 region of the eleven unique V(D)J recombinants using VHδ described in the text. The germ-line sequence of the 3′-end of VHδ, the two Dδ, are shown at the top. The germ-line Jδ sequences are shown on the right-hand side of the alignment interspersed amongst the cDNA sequences using each. Nucleotides in the junctions between the V, D, and J segments, shown italicized, are most likely N-nucleotides added by TdT.

The region corresponding to the junctions between the V, D, and J segments contained an additional sequence that could not be accounted for by the germ-line gene segments (fig. 4B). There are two possible sources of such a sequence. One is palindromic nucleotides that are created during V(D)J recombination when the RAG generates hairpin structures that are resolved asymmetrically during the re-ligation process.64Lewis 1994 The second is non-templated nucleotides that can be added by the enzyme terminal deoxynucleotidyl transferase (TdT) during the V(D)J recombination process.

An unusual feature of the platypus VHδ is the presence of a second cysteine encoded near the 3′-end of the gene, directly next to the cysteine predicted to form the intra-domain disulfide bond in immunoglobulin domains (fig. 4A). Additional cysteines in the complementarity-determining region 3 of VH domains have been thought to provide stability to unusually long CDR3 loops, as has been described for cattle and the platypus previously.65Johansson et al. 2002 The CDR3 of T-cell receptor δ using VHδ are only slightly longer than conventional δ chains (ranging 10–20 residues).66Rock et al. 1994; Wang et al. 2011 Furthermore, the stabilization of CDR3 generally involves multiple pairs of cysteines, which were not present in the platypus VHδ clones (fig. 4A). 

The Tasmanian specimen

The above concerns the animal collected from New South Wales. With the Tasmanian specimen, we were unable to amplify T-cell receptor δ transcripts containing VHδ from its splenic cDNA. We did, however, successfully isolate transcripts containing conventional Vα/δ segments, which provides a positive control.

It is possible that Tasmanian platypuses, which have been separated from the mainland population at least 14,000 years ago, either have a divergent VHδ or have deleted this single V gene altogether.67Lambeck and Chappell 2001

Sequence variation in VHδ

Although there is only a single VHδ in the current platypus genome assembly, there was sequence variation in the region corresponding to FR1 through FR3 of the V domains (see fig. 4A; the sequence data are not shown here, but are available in GenBank). We have three potential explanations for this variation:

  1. Two alleles of a single VHδ gene
  2. Somatic mutation of expressed VHδ genes
  3. Allelic variation in gene copy number

The two-allele explanation makes sense given that the RNA used in this experiment is from a wild-caught individual from the same population that was used to generate the whole-genome sequence, which was found to contain substantial heterozygosity.68Warren et al. 2008 However, the variation was too large to be fully explained by this. 

The second possibility, somatic mutation (i.e. mutation not occurring in germ cells), is considered controversial for T-cell receptor chains. Nonetheless, it has been invoked in sharks and postulated in salmonids to explain the variation that exceeds the apparent gene copy number in these vertebrates.69Yazawa et al. 2008; Chen et al. 2009 Therefore, it seems possible[17]I kind of like the original phrasing “it does not seem to be out of the realm of possibility” but that could be easily simplified, so I did. that somatic mutation is occurring in platypus VHδ. One piece of evidence in favor of this is that the mutations appear to be localized to the V region with no variation in the C region (fig. 4A). This may be due to the relatedness between VHδ and immunoglobulin VH genes where somatic hyper-mutation is well documented. Somatic mutation in immunoglobulin VH contributes to overall affinity maturation in secondary antibody responses.70Wysocki et al. 1986 However, this means that the evidence is mixed: the pattern of mutation seen in the platypus is found in the complementarity-determining region 3, which would be indicative of selection for affinity maturation, but was also found in the framework regions, which does not indicate this. As further evidence against the somatic mutation explanation, there is no evidence of somatic mutation in the V regions of birds, which also have only a single VHδ.71Parra et al. 2012 The contribution of mutation to the platypus TCRδ repertoire, if it is occurring, remains to be determined.

Alternatively, the sequence polymorphism may be due to VHδ gene copy number variation between individual TCRα/δ alleles.

Irrespective of the number of VHδ genes in the platypus TCRα/δ locus, the results clearly support T-cell receptor δ transcripts containing VHδ recombined to Dδ and Jδ gene segments in the TCRα/δ locus (fig. 4). A VHδ gene or genes in the platypus TCRα/δ locus in the genome assembly, therefore, does not appear to be an assembly artifact. Rather, it is present and functional, and contributes to the expressed T-cell receptor δ chain repertoire. The possibility that some platypus TCRα/δ loci contain more than a single VHδ does not alter the principal conclusions of this study.

Discussion of our Model of the Evolution of TCRα/δ and TCRµ

The results above make up the evidence that allowed us to construct the model shown after the introduction section (see fig. 2). Here we discuss various considerations about the model.

Previous hypothesis of the origin of TCRµ in mammals

Our previous hypothesis72Parra et al. 2008 about the origin of T-cell receptor µ (TCRµ) in mammals involved the recombination between an ancestral TCRα/δ locus and an immunoglobulin heavy (IgH) locus. The IgH locus would have contributed the V gene segments at the 5′-end, while the T-cell receptor δ would have contributed the D, J, and C genes at the 3′-end of the locus.

The difficulty with this hypothesis was the clear stability of the genome region surrounding the TCRα/δ locus. In other words, the chromosomal region containing the TCRα/δ locus appears to have remained relatively undisrupted for at least the past 360 million years.73Parra et al. 2008, 2010, 2012

VHδ in different vertebrate lineages

An alternative model for the origins of TCRµ emerged from the discovery, in amphibians and birds, of VHδ genes inserted into the TCRα/δ locus. This model involves the insertion of VH (fig. 2B) followed by the duplication and translocation of T-cell receptor genes (fig. 2C-E).

The insertion in the TCRα/δ locus seems to occur without disrupting the local syntenic region, as we know from zebra finches and frogs. In frogs, the IgH and TCRα/δ loci are tightly linked, which may have facilitated the translocation of VH genes into the TCRα/δ locus.74Parra et al. 2010

But close linkage is not a requirement. The genomes of birds and platypuses do not show such linkage, and the translocation of VH genes to the TCRα/δ locus appears to have occurred independently from frogs in these two lineages. We know this from the lack of similarity and relatedness between the VHδ genes of frogs, birds, and monotremes.75Parra et al. 2012 As can be seen in the phylogenetic tree of fig. 4, they appear derived each from different, ancient VH clans:

  • Clan I for birds
  • Clan II for frogs
  • Clan III for platypuses

Therefore, we suggest that the transfer of VHδ occurred independently in the different lineages. Another possibility is that transfers of VHδ may have occurred frequently and repeatedly in the past. Gene replacement may be the best explanation for the current content of these genes in the different tetrapod lineages.

The new evidence of platypus VHδ from this study allows us to update the model.

Updating the model for mammalian TCRµ

Let us contrast the evidence from marsupials with the evidence we have gathered from the platypus. In marsupials, there is no VHδ; the Vµ genes are highly divergent; and at least in the opossum, there is no conserved synteny with genes linked to TCRµ. These facts provide little insight into the origins of T-cell receptor µ and its relationship to other T-cell receptor chains like δ or the conventional ones.76Parra et al. 2008

In the platypus genome, however, we notice a striking similarity between VH, VHδ, and Vµ. These genes are all in clan III. In particular, the close relationship between the platypus VHδ and Vµ genes lends greater support for the model presented in fig. 2E, with TCRµ having been derived from TCRδ genes.

The similarity that we found here between the platypus VHδ and V genes in the TCRµ locus is, so far, the clearest evolutionary association between the µ and δ loci in one species.

Evolution of chains with three extracellular domains

TCRµ is an example of a T-cell receptor form with three extracellular domains (refer back to fig. 1). These forms have evolved at least twice in vertebrates. The first was in the ancestors of the cartilaginous fish in the form of NAR-TCR.77Criscitiello et al. 2006 The second was in the mammals as TCRµ.78Parra et al. 2007

As we discussed in the introduction, NAR-TCR uses an N-terminal V domain that is related to the V domains found in IgNAR antibodies, which are unique to cartilaginous fish,79Greenberg et al. 1995; Criscitiello et al. 2006 and not closely related to antibody VH domains. Therefore, it appears that NAR-TCR and TCRµ are more likely the result of convergent evolution rather than being related by direct descent.80Parra et al. 2007; Wang et al. 2011

Evolution of chains with antibody-like V domains

T-cell receptor chains that use antibody-like V domains, such as TCRδ using VHδ, NAR-TCR, or TCRµ (i.e. the receptors with yellow ovals in fig. 1) are widely distributed in vertebrates. Only the bony fish and placental mammals lack them.

In addition to NAR-TCR, some shark species appear to generate T-cell receptor chains using antibody V genes. This occurs via trans-locus V(D)J recombination between immunoglobulin IgM and IgW heavy chain V genes and TCRδ and TCRα D and J genes.81Criscitiello et al. 2010 This may be possible, in part, due to the multiple clusters of immunoglobulin genes found in the cartilaginous fish. It also illustrates that there have been independent solutions to generating T-cell receptor chains with antibody V domains in different vertebrate lineages.

In the tetrapods, the VH genes were trans-located into the T-cell receptor loci where they became part of the germ-line repertoire. By comparison, in cartilaginous fish, something equivalent may occur somatically during V(D)J recombination in developing T cells. Either mechanism suggests there has been selection for having T-cell receptors using antibody V genes over much of vertebrate evolutionary history.

What function do the antibody V chains serve? The current working hypothesis is that they are able to bind native antigen directly. This is consistent with a selective pressure for T-cell receptor chains that may bind or recognize antigen in ways similar to antibodies in many different lineages of vertebrates.

In the case of NAR-TCR and TCRµ, the N-terminal V domain (the “third” one) is likely to be unpaired and bind antigen as a single domain (see fig. 1), as has been described for IgNAR and some IgG antibodies in camels (recently reviewed in Flajnik et al. 2011). This model of antigen binding is consistent with the evidence that the N-terminal V domains in TCRµ are somatically diverse, while the second, supporting V domains have limited diversity and presumably perform a structural role rather than one of antigen recognition.82Parra et al. 2007; Wang et al. 2011

There is no evidence of double V domains in TCRδ chains using VHδ in frogs, birds, or platypus (rightmost part of fig. 1).83Parra et al. 2010, 2012 Rather, the complex containing VHδ would likely be structured similar to a conventional γδ receptors with a single V domain on each chain. It is possible that such receptors also bind antigen directly, but this remains to be determined.

A compelling model for the evolution of the immunoglobulin and T-cell receptor loci has been one of internal duplication, divergence and deletion. This is the so-called birth-and-death model of evolution of immune genes and was promoted by Nei and colleagues.84Ota and Nei 1994; Nei et al. 1997 Our results do not contradict that the birth-and-death mode of gene evolution has played a significant role in shaping these complex loci. However, our results do support the role of horizontal transfer of gene segments between the loci that had not been previously appreciated. With this mechanism, T cells may have been able to acquire the ability to recognize native, rather than processed antigen, much like B cells.

Notes

Notes
1 This is an example comment.
2 Major changes to the abstract: I split it in four paragraphs with section titles (this is common in some journals; it should be common in most journals). I also added a section at the beginning to state the main point of the paper. Scientists have the bad habit of starting with background information before we even know why we’re supposed to care. This fixes that.

The abstract is longer now, but not terribly so (286 vs. 267 words), so I think it’s fine; it could be shortened some more, but that would be a question of picking what to remove, which I’m less confident to do as I’m not the author.

Note that I rewrote the abstract after rewriting the rest.

3 Since this abbreviation comes up a lot, I put it first, with its meaning in parentheses.
4 I didn’t change much in the figure’s caption, but it seemed pretty trivial to add color to the text to facilitate looking up what the colors mean.
5 This is an example of two sentences taken verbatim from the original paper. Not all of it was poorly written!
6 It took me forever to rewrite this part. The original sentence was, “Diversity in antibodies produced by B cells is also generated by RAG-mediated V(D)J recombination and the TCR and Ig genes clearly share a common origin in the jawed-vertebrates.” Soooo many things wrong here.

First, the weirdly formatted term “V(D)J” was not defined anywhere. I assume it means “V, J, and optionally D,” but it’s not as obvious as the authors seem to think.

Second, why are we talking about B cells? They don’t come up anywhere else except in the very last sentence of the paper. We’ve been talking about T cells; if you’re going to switch to a different but similarly named type of cell, then you should tell the reader explicitly.

Third, this is two different ideas linked together with an “and”. I have no clue why it was written as a single sentence, except maybe for the bad reason of having the citations refer to both ideas. They’re so different that it made sense to split them into not only distinct sentences or paragraphs, but actual sections!

7 The original combined this sentence and the next, even though they’re about quite distinct ideas: the name of the genes, and the species where they’re found.
8 Why not indicate the part of the figure that is relevant? Whenever you can, provide reader guidance!
9 The authors like to use “duckbill platypus,” but there’s only one species of platypus, so I took that word out.
10 Another horrible sentence from the original, recorded for posterity: “Trans-locus V(D)J recombination of V genes from other Ig and TCR loci with TCRµ genes has not been found.” That distance between the subject (recombination) and the verb (has). Ugh.
11 The abbreviation IgSF was used in the paper, with no explanation. I assume the people who would read this paper tend to know what that means, but still.
12 Major change from me here. This section was moved here from the discussion, because it is the core and most interesting part of the paper. It is now its own first-level section alongside Introduction, Materials and Methods, etc.

I also simplified the contents. The six stages used to be identified with letters A-F in the figure, and 1-6 in the text. I changed that to use letters everywhere. I removed most of the figure’s caption since it repeats the text.

There was an inconsistency in calling the same thing the Dδ–Jδ–Cδ cluster in the figure and D–J–Cδ cluster in the text. I fixed that. I also color-coded the elements in the text according to the figure.

One thing I didn’t like about the original figure is that the six stages aren’t sequential. The figure presented steps A to F as if they followed one another, but steps C, D and E-F describe the evolution in different animal lineages. So I reorganized the contents and added some arrows for clarification. It also seems that the steps 5-6 in the text and E-F in the figure didn’t quite match, with some parts illustrated in step F being explained in step 5; I edited the text so that they do match. I think the figure could be improved much more, notably by splitting the complex F stage in multiple steps, but I don’t want to change it too much.

13 This new paragraph is important! It gives context to the experiments below and it guides the reader for the entire section. Also notice this is a case of an enumeration without point form. I like point form, but it must not be overused.
14 In the original paper, this section comes after the Confirmation of Expression section below, but in the results section, the phylogenetic results are discussed first. I don’t know if there was a reason for this (maybe they performed the phylogenetic analysis later) but it seems better to keep the same order in both sections, which is why I’m placing this part here.
15 Yes, you are allowed to make links between the sections of your paper like this!
16 I’m not sure about this but the original phrase was bona fide, which I had to look up. Maybe “authentic” between quotes isn’t the best translation, but a translation is better than a Latin phrase that many people will not get.
17 I kind of like the original phrasing “it does not seem to be out of the realm of possibility” but that could be easily simplified, so I did.
Categories
original research

An Annotated Reading of a Paper about Platypuses

Here I present a paper I chose to rewrite as a demonstration for the JAWWS project. The original text and figures are reproduced below,1the paper has a Creative Commons non-commercial license interspersed with my comments in the following format:

hello I am a blue comment in a quote-block

Feel free to just read the comments. Annotating the paper was a first step in the process. Next I will focus on the rewriting per se. Should be fun!

I didn’t have a particularly strict selection procedure — I went on ResearchHub, in the evolutionary biology section (since that used to be my field), and picked one that seemed appropriate. A cursory skimming showed it had plenty of abbreviations and long paragraphs, which suggested there was a lot of room for improvement.

Also, it’s about platypuses. Or platypi. Platypodes. Whatever.

Here are the metadata:

  • Title: “A Model for the Evolution of the Mammalian T-cell Receptor α/δ and μ Loci Based on Evidence from the Duckbill Platypus”
  • Authors: Zuly E. Parra, Mette Lillie, Robert D. Miller
  • Journal: Molecular Biology and Evolution
  • Link to original version
  • Word count: 5,800 words.

A disclaimer: some of the comments below will be harsh. Again, I don’t mean to attack the authors, who did their job as well as they could, and in fact succeeded at it — after all, they managed to publish their work!

With that, let’s pretend we’re semi-aquatic platypuses and dive in.

A Model for the Evolution of the Mammalian T-cell Receptor α/δ and μ Loci Based on Evidence from the Duckbill Platypus

Comments: Okay, this paper is going to be about T cells (I vaguely remember this being about immunity?), platypuses, and evolution. Sounds good.

Abstract

The specific recognition of antigen by T cells is critical to the generation of adaptive immune responses in vertebrates. T cells recognize antigen using a somatically diversified T-cell receptor (TCR). All jawed vertebrates use four TCR chains called α, β, γ, and δ, which are expressed as either a αβ or γδ heterodimer. Nonplacental mammals (monotremes and marsupials) are unusual in that their genomes encode a fifth TCR chain, called TCRµ, whose function is not known but is also somatically diversified like the conventional chains. The origins of TCRµ are also unclear, although it appears distantly related to TCRδ. Recent analysis of avian and amphibian genomes has provided insight into a model for understanding the evolution of the TCRδ genes in tetrapods that was not evident from humans, mice, or other commonly studied placental (eutherian) mammals. An analysis of the genes encoding the TCRδ chains in the duckbill platypus revealed the presence of a highly divergent variable (V) gene, indistinguishable from immunoglobulin heavy (IgH) chain V genes (VH) and related to V genes used in TCRµ. They are expressed as part of TCRδ repertoire (VHδ) and similar to what has been found in frogs and birds. This, however, is the first time a VHδ has been found in a mammal and provides a critical link in reconstructing the evolutionary history of TCRµ. The current structure of TCRδ and TCRµ genes in tetrapods suggests ancient and possibly recurring translocations of gene segments between the IgH and TCRδ genes, as well as translocations of TCRδ genes out of the TCRα/δ locus early in mammals, creating the TCRµ locus.

Comments: That’s a pretty dense abstract. There’s a lot of acronyms in there, which I find distracting. Also, it’s not immediately obvious why we should be interested in this paper. It seems to be this: studying platypuses uncovered new information about how T cells evolved. But that info is buried in the fourth sentence and beyond.

Introduction

T lymphocytes are critical to the adaptive immune system of all jawed vertebrates and can be classified into two main lineages based on the T-cell receptor (TCR) they use (Rast et al. 1997; reviewed in Davis and Chein 2008). The majority of circulating human T cells are the αβT cell lineage which use a TCR composed of a heterodimer of α and β TCR chains. αβT cells include the familiar T cell subsets such as CD4+ helper T cells and regulatory T cells, CD8+ cytotoxic T cells, and natural killer T (NKT) cells. T cells that are found primarily in epithelial tissues and a lower percentage of circulating lymphocytes in some species express a TCR composed of γ and δ TCR chains. The function of these γδ T cells is less well defined and they have been associated with a broad range of immune responses including tumor surveillance, innate responses to pathogens and stress, and wound healing (Hayday 2009). αβ and γδ T cells also differ in the way they interact with antigen. αβTCR are major histocompatibility complex (MHC) “restricted” in that they bind antigenic epitopes, such as peptide fragments, bound to, or “presented” by, molecules encoded in the MHC. In contrast, γδTCR have been found to bind antigens directly in the absence of MHC, as well as self-ligands that are often MHC-related molecules (Sciammas et al. 1994Hayday 2009).

I can hardly think of a less exciting introduction. I’m expecting talk of platypuses, of puzzling questions about evolution or the immune system — and all I get is a boring lecture on T cells. Make no mistake: all of this information is important. We need to know a T cell is, what’s a T-cell receptor, and that there exist at least two kinds (αβ and γδ).

But this information shouldn’t be put first. And it could definitely be split up into more paragraphs.

The conventional TCR chains are composed of two extracellular domains that are both members of the immunoglobulin (Ig) domain super-family (reviewed in Davis and Chein 2008) (fig. 1). The membrane proximal domain is the constant (C) domain, which is largely invariant amongst T-cell clones expressing the same class of TCR chain, and is usually encoded by a single, intact exon. The membrane distal domain is called the variable (V) domain and is the region of the TCR that contacts antigen and MHC. Similar to antibodies, the individual clonal diversity in the TCR V domains is generated by somatic DNA recombination (Tonegawa 1983). The exons encoding TCR V domains are assembled somatically from germ-line gene segments, called the V, diversity (D), and joining (J) genes, in developing T cells, a process dependent upon the enzymes encoded by the recombination activating genes (RAG)-1 and RAG-2 (Yancopoulos et al. 1986Schatz et al. 1989). The exons encoding the V domains of TCR β and δ chains are assembled from all three types of gene segments, whereas the α and γ chains use only V and J. The different combinations of V, D, and J or V and J, selected from a large repertoire of germ-line gene segments, along with variation at the junctions due to addition and deletion of nucleotides during recombination, contribute to a vast TCR diversity. It is this diversity that creates the individual antigen specificity of T-cell clones.

Fig. 1.
Cartoon diagram of the TCR forms found in different species. Oblong circles indicate Ig super-family domains and are color coded as C domains (blue), conventional TCR V domains (red), and VHδ or Vµ (yellow). The gray shaded chains represent the hypothetical partner chain for TCRµ and TCRδ using VHδ.
The figure helps, but again, why are we reading this? This paper seems to follow the common pattern in which the introduction gradually “zooms into” the main point. This is not a good pattern, because it doesn’t tell us the reason for this information. Sure, we suspect it’s relevant to understand what comes next, but without any mystery to anchor this to, it’s hard to be really engaged.

The TCR genes are highly conserved among species in both genomic sequence and organization (Rast et al. 1997Parra et al. 20082012Chen et al. 2009). In all tetrapods examined, the TCRβ and γ chains are each encoded at separate loci, whereas the genes encoding the α and δ chains are nested at a single locus (TCRα/δ) (Chien et al. 1987Satyanarayana et al. 1988; reviewed in Davis and Chein 2008). The V domains of TCRα and TCRδ chains can use a common pool of V gene segments, but distinct D, J, and C genes.

Diversity in antibodies produced by B cells is also generated by RAG-mediated V(D)J recombination and the TCR and Ig genes clearly share a common origin in the jawed-vertebrates (Flajnik and Kasahara 2010Litman et al. 2010). However, the V, D, J, and C coding regions in TCR have diverged sufficiently over the past >400 million years (MY) from Ig genes that they are readily distinguishable, at least for the conventional TCR. Recently, the boundary between TCR and Ig genes has been blurred with the discovery of non-conventional TCRδ isoforms that have been found that use V genes that appear indistinguishable from Ig heavy chain V (VH) (Parra et al. 20102012). Such V genes have been designated as VHδ and have been found in both amphibians and birds (fig. 1). In the frog Xenopus tropicalis, and a passerine bird, the zebra finch Taeniopygia guttata the VHδ are located within the TCRα/δ loci where they co-exist with conventional Vα and Vδ genes (Parra et al. 20102012). In galliform birds, such as the chicken Gallus gallus, VHδ are present but located at a second TCRδ locus that is unlinked to the conventional TCRα/δ (Parra et al. 2012). VHδ are the only type of V gene segment present at the second locus and, although closely related to antibody VH genes, the VHδ appear to be used exclusively in TCRδ chains. This is true as well for frogs where the TCRα/δ and IgH loci are tightly linked (Parra et al. 2010).

Okay… different species have slightly different genes… Cool.

Also, “MY” for million years, really? Do we really need that, especially when there are already about five abbreviations per sentence?

The TCRα/δ loci have been characterized in several eutherian mammal species and at least one marsupial, the opossum Monodelphis domestica, and VHδ genes have not been found to date (Satyanarayana et al.1988Wang et al. 1994Parra et al. 2008). However, marsupials do have an additional TCR locus, unlinked to TCRα/δ, that uses antibody-related V genes. This fifth TCR chain is called TCRµ and is related to TCRδ, although it is highly divergent in sequence and structure (Parra et al. 20072008). A TCRµ has also been found in the duckbill platypus and is clearly orthologous to the marsupial genes, consistent with this TCR chain being ancient in mammals, although it has been lost in the eutherians (Parra et al. 2008Wang et al. 2011). TCRµ chains use their own unique set of V genes (Vµ) (Parra et al. 2007Wang et al. 2011). Trans-locus V(D)J recombination of V genes from other Ig and TCR loci with TCRµ genes has not been found. So far, TCRµ homologues have not been found in non-mammals (Parra et al. 2008).

After an overview of non-mammal tetrapods (frogs, birds), we’re now talking about mammals: platypuses, marsupials, eutherians. It seems like the zooming in is coming to an end…

TCRµ chains are atypical in that they contain three extra-cellular IgSF domains rather than the conventional two, due to an extra N-terminal V domain (fig. 1) (Parra et al. 2007Wang et al. 2011). Both V domains are encoded by a unique set of Vµ genes and are more related to Ig VH than to conventional TCR V domains. The N-terminal V domain is diverse and encoded by genes that undergo somatic V(D)J recombination. The second or supporting V domain has little or no diversity. In marsupials this V domain is encoded by a germ-line joined, or pre-assembled, V exon that is invariant (Parra et al. 2007). The second V domain in platypus is encoded by gene segments requiring somatic DNA recombination; however, only limited diversity is generated partly due to the lack of D segments (Wang et al. 2011). A TCR chain structurally similar to TCRµ has also been described in sharks and other cartilaginous fish (fig. 1) (Criscitiello et al. 2006Flajnik et al. 2011). This TCR, called NAR-TCR, also contains three extracellular domains, with the N-terminal V domain being related to those used by IgNAR antibodies, a type of antibody found only in sharks (Greenberg et al. 1995). The current working model for both TCRµ and NAR-TCR is that the N-terminal V domain is unpaired and acts as a single, antigen binding domain, analogous to the V domains of light-chainless antibodies found in sharks and camelids (Flajnik et al. 2011Wang et al. 2011).

I’ve tried reading this paragraph like five times and I’m still not sure what it’s trying to say. It feels like it’s mostly disjointed sentences that had to be included so the authors can assume you know this, but since we still don’t have a vision of the larger picture, it’s really hard to pay attention.

Phylogenetic analyses support the origins of TCRµ occurring after the avian–mammalian split (Parra et al. 2007Wang et al. 2011). Previously, we hypothesized the origin of TCRµ being the result of a recombination between ancestral IgH and TCRδ-like loci (Parra et al. 2008). This hypothesis, however, is problematic for a number of reasons. One challenge is the apparent genomic stability and ancient conserved synteny in the region surrounding the TCRα/δ locus; this region has appeared to remain stable over at least the past 350 MY of tetrapod evolution (Parra et al. 20082010). The discovery of VHδ genes inserted into the TCRα/δ locus of amphibians and birds has provided an alternative model for the origins of TCRµ; this model involves both the insertion of VH followed by the duplication and translocation of TCR genes. Here we present the model along with supporting evidence drawn from the structure of the platypus TCRα/δ locus, which is also the first analysis of this complex locus in a monotreme.

The last sentence is the first interesting one of the entire paper. It could have come earlier. Technically we should know this from the abstract, but the abstract was pretty difficult to read too.

Also, this is definitely at least two paragraphs merged into one: the first about the previous hypothesis, and the second about the alternative model that is going to be presented.

Materials and Methods

The intro was painful, and usually materials and methods are even worse. We’ll see! 🙂

Identification and Annotation of the Platypus TCRα/δ Locus

The analyses were performed using the platypus (Ornithorhynchus anatinus) genome assembly version 5.0.1 (http://www.ncbi.nlm.nih.gov/genome/guide/platypus/). The platypus genome was analyzed using the whole-genome BLAST available at NCBI (www.ncbi.nlm.nih.gov/) and the BLAST/BLAT tool from Ensembl (www.ensembl.org). The V and J segments were located by similarity to corresponding segments from other species and by identifying the flanking conserved recombination signal sequences (RSS). V gene segments were annotated 5′ to 3′ as Vα or Vδ followed by the family number and the gene segment number if there were greater than one in the family. For example, Vα15.7 is the seventh Vα gene in family 15. The D segments were identified using complementarity-determining region-3 (CDR3) sequences that represent the V–D–J junctions, from cDNA clones using VHδ. Platypus TCR gene segments were labeled according to the IMGT nomenclature (http://www.imgt.org/). The location for the TCRα/δ genes in the platypus genome version 5.0.1 is provided in supplementary table S1Supplementary Material online.

Actually, this isn’t that bad: it’s easier to follow than the introduction because it tells us sequential actions. They make sense together.

But there are a few things wrong here. First, the use of the dreaded passive voice. “The analyses were performed …” No! Tell us who performed it! Second, it’s a pretty dense paragraph and the only one in its section (Identification and Annotation …), which means there’s no benefit to bundling all these sentences together: the title already serves this purpose. Third, it lacks some sentence to tell us what the goal is. The intro was not clear enough to assume readers know what the end point of these analyses is.

Confirmation of Expression of Platypus VHδ

Reverse transcription PCR (RT–PCR) was performed on total splenic RNA extracted from a male platypus from the Upper Barnard River, New South Wales, Australia. This platypus was collected under the same permits as in Warren et al. (2008). The cDNA synthesis step was carried out using the Invitrogen Superscript III-first strand synthesis kit according to the manufacturer’s recommended protocol (Invitrogen, Carlsbad, CA, USA). TCRδ transcripts containing VHδ were targeted using primers specific for the Cδ and VHδ genes identified in the platypus genome assembly (Warren et al. 2008). PCR amplification was performed using the QIAGEN HotStar HiFidelity Polymerase Kit (BD Biosciences, CLONTECH Laboratories, Palo Alto, CA, USA) in total volume of 20 µl containing 1× Hotstar Hifi PCR Buffer (containing 0.3 mM dNTPs), 1µM of primers, and 1.25U Hotstar Hifidelity DNA polymerase. The PCR primers used were 5′-GTACCGCCAACCACCAGGGAAAG-3′ and 5′-CAGTTCACTGCTCCATCGCTTTCA-3′ for the VHδ and Cδ, respectively. A previously described platypus spleen cDNA library constructed from RNA extracted from tissue from a Tasmanian animal was also used (Vernersson et al. 2002).

PCR products were cloned using TopoTA cloning® kit (Invitrogen). Sequencing was performed using the BigDye terminator cycle sequencing kit version 3 (Applied Biosystems, Foster City, CA, USA) and according to the manufacturer recommendations. Sequencing reactions were analyzed using the ABI Prism 3100 DNA automated sequences (PerkinElmer Life and Analytical Sciences, Wellesley, MA, USA). Chromatograms were analyzed using the Sequencher 4.9 software (Gene Codes Corporation, Ann Arbor, MI, USA). Sequences have been archived on GenBank under accession numbers JQ664690–JQ664710.

This seems to be mostly a list of the machines, substances, protocols etc. that were used. Accordingly, it should be formatted as a list. It doesn’t read well as a paragraph (nor should it be expected to).

Phylogenetic Analyses

Nucleotide sequences from FR1 to FR3 of the V genes regions, including CDR1 and CDR2, were aligned using BioEdit (Hall 1999) and the accessory application ClustalX (Thompson et al. 1997). Nucleotide alignments analyzed were based on amino acid sequence to establish codon position (Hall 1999). Alignments were corrected by visual inspection when necessary and were then analyzed using the MEGA Software (Kumar et al. 2004). Neighbor joining (NJ) with uncorrected nucleotide differences (p-distance) and minimum evolution distances methods were used. Support for the generated trees was evaluated based on bootstrap values generated by 1000 replicates. GenBank accession numbers for sequences used in the tree construction are in supplementary table S2Supplementary Material online.

I have a graduate degree in evolutionary biology, I’ve done plenty of phylogenetic analyses (building trees of life), and somehow I hadn’t understood yet that this is what this paper was about. Maybe that’s really obvious to practicing evolutionary biologists, but it seems to me that the kind of analysis could have been made more obvious earlier.

Results and Discussion

Not a bad idea to merge results and discussion together IMO, as long as it doesn’t hinder comprehension.

The TCRα/δ locus was identified in the current platypus genome assembly and the V, D, J, and C gene segments and exons were annotated and characterized (fig. 2). The majority of the locus was present on a single scaffold, with the remainder on a shorter contig (fig. 2). Flanking the locus were SALL2DAD1 and several olfactory receptor (OR) genes, all of which share conserved synteny with the TCRα/δ locus in amphibians, birds, and mammals (Parra et al. 200820102012). The platypus locus has many typical features common to TCRα/δ loci in other tetrapods (Satyanarayana et al. 1988Wang et al. 1994Parra et al. 200820102012). Two C region genes were present: a Cα that is the most 3′ coding segment in the locus, and a Cδ oriented 5′ of the Jα genes. There is a large number of Jα gene segments (n = 32) located between the Cδ and Cα genes. Such a large array of Jα genes are believed to facilitate secondary Vα to Jα rearrangements in developing αβT cells if the primary rearrangements are nonproductive or need replacement (Hawwari and Krangel 2007). Primary TCRα V–J rearrangments generally use Jα segments towards the 5′-end of the array and can progressively use downstream Jα in subsequent rearrangements. There is also a single Vδ gene in reverse transcriptional orientation between the platypus Cδ gene and the Jα array that is conserved in mammalian TCRα/δ both in location and orientation (Parra et al. 2008).

Fig. 2.
Annotated map of the platypus TCRα/δ locus showing the locations of the Vα and Vδ (red), VHδ (yellow), Dδ (orange), Jα and Jδ (green), Cδ (dark blue), and Cα (light blue). Conserved syntenic genes are in gray. The scaffold and contig numbers are indicated.
Oof. I had to actually add line breaks to this paragraph to parse it. It mostly says the same things as the figure, which isn’t too bad. Repeating important info in multiple formats is a good idea. The figure itself could have been clearer, though — it took me a few minutes to understand that the multiple lines in it represent contiguous segments of the chromosome (at least that’s what I think it means). I also had to look up what “synteny” means: it’s having the same order for genetic elements across species. 
There are 99 conventional TCR V gene segments in the platypus TCRα/δ locus, 89 of which share nucleotide identity with Vα in other species and 10 that share identity with Vδ genes. The Vδ genes are clustered towards the 3′-end of the locus. Based on nucleotide identity shared among the platypus V genes they can be classified into 17 different Vα families and two different Vδ families, based on the criteria of a V family sharing >80% nucleotide identity (not shown, but annotated in fig. 2). This is also a typical level of complexity for mammalian Vα and Vδ genes (Giudicelli et al. 2005Parra et al. 2008). Also present were two Dδ and seven Jδ gene segments oriented upstream of the Cδ. All gene segments were flanked by canonical RSS, which are the recognition substrate of the RAG recombinase. The D segments were asymmetrically flanked by an RSS containing at 12 bp spacer on the 5′-side and 23 bp spacer on the 3′-side, as has been shown previously for TCR D gene segments in other species (Carroll et al. 1993Parra et al. 20072010). In summary, the overall content and organization of the platypus TCRα/δ locus appeared fairly generic.

The last sentence seems to be the main takeaway. I would have put it first.

What is atypical in the platypus TCRα/δ locus was the presence of an additional V gene that shared greater identity to antibody VH genes than to TCR V genes (figs. 2 and 3). This V gene segment was the most proximal of the V genes to the D and J genes and was tentatively designated as VHδ. VHδ are, by definition, V genes indistinguishable from Ig VH genes but used in encoding TCRδ chains and have previously been found only in the genomes of birds and frogs (Parra et al. 200820102012).

Shortish paragraph, intriguing first sentence — good job!

Fig. 3.
Phylogenetic tree of mammalian VH genes including the platypus VHδ and monotreme Vµ. The three major VH clans are bracketed. The platypus VHδ is boxed and the clade containing platypus VHδ along with platypus and echidna Vµ is in bold and indicated by a smaller bracket in VH clan III. The three-digit numbers following the VH gene labels are the last three digits of the GenBank accession number referenced in supplementary table S2, Supplementary Material online. The numbers following the platypus and echidna Vµ labels are clone numbers. The tree presented was generated using the Minimum Evolution method. Similar topology was generation using the Neighbor Joining method.

Maybe that’s the ex-biologist speaking, but I personally really like phylogenetic trees. I find them quite illustrative. On the other hand, I, uh, didn’t remember at all what a VH gene is, so I had to go back to the introduction. There should have been a way to make it clearer, since VH genes play a big role in the results.

Also, not important, but there’s a big typo in the last sentence (generation should have been generated).

VH genes from mammals and other tetrapods have been shown to cluster into three ancient clans and individual species differ in the presence of one or more of these clans in their germ-line IgH locus (Tutter and Riblet 1989Ota and Nei 1994). For example, humans, mice, echidnas, and frogs have VH genes from all three clans (Schwager et al. 1989Ota and Nei 1994Belov and Hellman 2003), whereas rabbits, opossums, and chickens have only a single clan (McCormack et al. 1991Butler 1997Johansson et al. 2002Baker et al. 2005). In phylogenetic analyses, the platypus VHδ was most related to the platypus Vµ genes found in the TCRµ locus in this species (fig. 3). Platypus VHδ, however, share only 51–61% nucleotide identity (average 56.6%) with the platypus Vµ genes. Both the platypus Vµ and VHδ clustered within clan III (fig. 3) (Wang et al. 2011). This is noteworthy given that VH genes in the platypus IgH locus are also clan III and, in general, clan III VH are the most ubiquitous and conserved lineage of VH (Johansson et al. 2002Tutter and Riblet 1989). Although clearly related to platypus VH, the VHδ gene share only 34–65% nucleotide identity (average 56.9%) with the bona fide VH used in antibody heavy chains in this species.

Okay, this explains the three VH parts in the tree. It’s pretty clear.

It was necessary to rule out that the VHδ gene present in the platypus TCRα/δ locus was not an artifact of the genome assembly process. One piece of supporting evidence would be the demonstration that the VHδ is recombined to downstream Dδ and Jδ segments and expressed with Cδ in complete TCRδ transcripts. PCR using primers specific for VHδ and Cδ was performed on cDNA synthesized from splenic RNA from two different platypuses, one from New South Wales and the other from Tasmania. PCR products were successfully amplified from the NSW animal and these were cloned and sequenced. Twenty clones, each containing unique nucleotide sequence, were characterized and found to contain the VHδ recombined to the Dδ and Jδ gene segments (fig. 4A). Of these 20, 11 had unique V, D, and J combinations that would encode 11 different complementarity-determining regions-3 (CDR3) (fig. 4B). More than half of the CDR3 (8 out of 11) contained evidence of using both D genes (VDDJ) (fig. 4B). This is a common feature of TCRδ V domains where multiple D genes can be incorporated into the recombination due to the presence of asymmetrical RSS (Carroll et al. 1993). The region corresponding to the junctions between the V, D, and J segments, contained additional sequence that could not be accounted for by the germ-line gene segments (fig. 4B). There are two possible sources of such sequence. One are palindromic (P) nucleotides that are created during V(D)J recombination when the RAG generates hairpin structures that are resolved asymmetrically during the re-ligation process (Lewis 1994). The second are non-templated (N) nucleotides that can be added by the enzyme terminal deoxynucleotidyl transferase (TdT) during the V(D)J recombination process. An unusual feature of the platypus VHδ is the presence of a second cysteine encoded near the 3′-end of the gene, directly next to the cysteine predicted to form the intra-domain disulfide bond in Ig domains (fig. 4A). Additional cysteines in the CDR3 region of VH domains have been thought to provide stability to unusually long CDR3 loops, as has been described for cattle and the platypus previously (Johansson et al. 2002). The CDR3 of TCRδ using VHδ are only slightly longer than conventional TCRδ chains (ranging 10–20 residues) (Rock et al. 1994Wang et al. 2011). Furthermore, the stabilization of CDR3 generally involves multiple pairs of cysteines, which were not present in the platypus VHδ clones (fig. 4A). Attempts to amplify TCRδ transcripts containing VHδ from splenic RNA obtained from the Tasmanian animal were unsuccessful. As a positive control, TCRδ transcripts containing conventional Vα/δ were successfully isolated, however. It is possible that Tasmanian platypuses, which have been separated from the mainland population at least 14,000 years either have a divergent VHδ or have deleted this single V gene altogether (Lambeck and Chappell 2001).

I like the thought process: “hey, our results may have been an artifact, here’s what we did to prove it wasn’t.” But why is this paragraph so long? Seems like it could have been multiple smaller ones, perhaps with a section subheading.

Fig. 4.
(A) Alignment of predicted protein sequence of transcripts containing a recombined VHδ gene isolated from platypus spleen RNA. The individual clones are identified by the last three digits of their GenBank accession numbers (JQ664690–JQ664710). Shown is the region from FR3 of the VHδ through the beginning of the Cδ domain. The sequence in bold at the top of the alignment is the germ-line VHδ and Cδ gene sequence. The double cysteines at the end of FR3 and unpaired cysteines in CDR3 are shaded, as is the canonical FGXG in FR4. (B) Nucleotide sequence of the CDR3 region of the eleven unique V(D)J recombinants using VHδ described in the text. The germ-line sequence of the 3′-end of VHδ, the two Dδ, are shown at the top. The germ-line Jδ sequences are shown on the right-hand side of the alignment interspersed amongst the cDNA sequences using each. Nucleotides in the junctions between the V, D, and J segments, shown italicized, are most likely N-nucleotides added by TdT.

This figure is probably good to visualize what their results actually looked like, but it also seems like a way to cram as much information in a visual and its caption as humanly possible… I’ll let it pass. It’s fine that some parts of the paper go more in depth, if they can be easily ignored, as I think is the case here.

Small nitpick: This is two figures, and I would preferred that this fact would have been clearer. A small “(A)” and “(B)” in the paragraph doesn’t really help the reader.

Although there is only a single VHδ in the current platypus genome assembly, there was sequence variation in the region corresponding to FR1 through FR3 of the V domains (fig. 4A and sequence data not shown but available in GenBank). Some of this variation could represent two alleles of a single VHδ gene. Indeed, the RNA used in this experiment is from a wild-caught individual from the same population that was used to generate the whole-genome sequence and was found to contain substantial heterozygosity (Warren et al. 2008). There was greater variation in the transcribed sequences, however, than could be explained simply by two alleles of a single gene (fig. 4A). Two alternative explanations are the occurrence of somatic mutation of expressed VHδ genes or allelic variation in gene copy number. Somatic mutation in TCR chains is controversial. Nonetheless, it has been invoked to explain the variation in expressed TCR chains that exceeds the apparent gene copy number in sharks, and has also been postulated to occur in salmonids (Yazawa et al. 2008Chen et al. 2009). Therefore, it does not seem to be out of the realm of possibility that somatic mutation is occurring in platypus VHδ. Indeed, the mutations appear to be localized to the V region with no variation in the C region (fig. 4A). This may be due to its relatedness of VHδ to Ig VH genes where somatic hyper-mutation is well documented. Such somatic mutation contributes to overall affinity maturation in secondary antibody responses (Wysocki et al. 1986). The pattern of mutation seen in platypus VHδ however, is not localized to the CDR3, which would be indicative of selection for affinity maturation, but was also found in the framework regions. Furthermore, in the avian genomes where there is also only a single VHδ, there was no evidence of somatic mutation in the V regions (Parra et al. 2012). The contribution of mutation to the platypus TCRδ repertoire, if it is occurring, remains to be determined. Alternatively, the sequence polymorphism may be due to VHδ gene copy number variation between individual TCRα/δ alleles.

Not the worst paragraph, but again, doesn’t need to be a Wall of Text.

Irrespective of the number of VHδ genes in the platypus TCRα/δ locus, the results clearly support TCRδ transcripts containing VHδ recombined to Dδ and Jδ gene segments in the TCRα/δ locus (fig. 4). A VHδ gene or genes in the platypus TCRα/δ locus in the genome assembly, therefore, does not appear to be an assembly artifact. Rather it is present, functional and contributes to the expressed TCRδ chain repertoire. The possibility that some platypus TCRα/δ loci contain more than a single VHδ does not alter the principal conclusions of this study.

Previously, we hypothesized the origin of TCRµ in mammals involving the recombination between and ancestral TCRα/δ locus and an IgH locus (Parra et al. 2008). The IgH locus would have contributed the V gene segments at the 5′-end of the locus, with the TCRδ contributing the D, J, and C genes at the 3′-end of the locus. The difficulty with this hypothesis was the clear stability of the genome region surrounding the TCRα/δ locus. In other words, the chromosomal region containing the TCRα/δ locus appears to have remained relatively undisrupted for at least the past 360 million years (Parra et al. 200820102012). The discovery of VHδ genes within the TCRα/δ loci of frog and zebra finch is consistent with insertions occurring without apparently disrupting the local syntenic region. In frogs, the IgH and TCRα/δ loci are tightly linked, which may have facilitated the translocation of VH genes into the TCRα/δ locus (Parra et al. 2010). However, close linkage is not a requirement since the translocation of VH genes appears to have occurred independently in birds and monotremes, due to the lack of similarity between the VHδ in frogs, birds, and monotremes (Parra et al. 2012). Indeed, it would appear is if the acquisition of VH genes into the TCRα/δ locus occurred independently in each lineage.

The similarity between the platypus VHδ and V genes in the TCRµ locus is, so far, the clearest evolutionary association between the TCRµ and TCRδ loci in one species. From the comparison of the TCRα/δ loci in frogs, birds, and monotremes, a model for the evolution of TCRµ and other TCRδ forms emerges (fig. 5), which can be summarized as follows:

Oooh, exciting! The title promised a model, and at last we get it. Also it seems that below we get point-form stuff! I like point-form stuff. It’s often really helpful to guide the reader.

  1. Early in the evolution of tetrapods, or earlier, a duplication of the D–J–Cδ cluster occurred resulting in the presence of two Cδ each with its own set of Dδ and Jδ segments (fig. 5A).

  2. Subsequently, a VH gene or genes was translocated from the IgH locus and inserted into the TCRα/δ locus, most likely to a location between the existing Vα/Vδ genes and the 5′-proximal D–J–Cδ cluster (fig. 5B). This resulted in the configuration like that which currently exists in the zebra finch genome (Parra et al. 2012).

  3. In the amphibian lineage there was an inversion of the region containing VHδ–Dδ–Jδ–Cδ cluster and an expansion in the number of VHδ genes (fig. 5C). Currently, X. tropicalis has the greatest number of VHδ genes, where they make up the majority of V genes available in the germ-line for use in TCRδ chains (Parra et al. 2010).

  4. In the galliform lineage (chicken and turkey), the VHδ–Dδ–Jδ–Cδ cluster was trans-located out of the TCRα/δ locus where it currently resides on another chromosome (fig. 5D). There are no Vα or Vδ genes at the site of the second chicken TCRδ locus and only a single Cδ gene remains in the conventional TCRα/δ locus (Parra et al. 2012).

  5. Similar to galliform birds, the VHδ–Dδ–Jδ–Cδ cluster was trans-located out of the TCRα/δ locus in presumably the last common ancestor of mammals, giving rise to TCRµ (fig. 5E). Internal duplications of the VHδ–Dδ–Jδ genes gave rise to the current [(V–D–J) − (V–D–J) − C] organization necessary to encode TCR chains with double V domains (Parra et al. 2007Wang et al. 2011). In the platypus, the second V–D–J cluster, encoding the supporting V, has lost its D segments and generates V domains with short CDR3 encoded by direct V to J recombination (Wang et al. 2011). The whole cluster appears to have undergone additional tandem duplication as it exists in multiple tandem copies in the opossum and also likely in the platypus (Parra et al. 20072008Wang et al. 2011).

  6. In the therian lineage (marsupials and placentals), the VHδ was lost from the TCRα/δ locus (Parra et al. 2008). In placental mammals, the TCRµ locus was also lost (Parra et al. 2008). The marsupials retained TCRµ, however the second set of V and J segments, encoding the supporting V domain in the protein chain, were replaced with a germ-line joined V gene, in a process most likely involving germ-line V(D)J recombination and retro-transposition (fig. 5F) (Parra et al. 20072008).

Yeah, this was good. These point-form paragraphs, combined with Fig. 5 (below) did more to help me understand the paper than anything else so far. I kind of wish the paper had just opened with this, and then proceeded to explain the reasoning behind.

TCR forms such as TCRµ, which contain three extracellular domains, have evolved at least twice in vertebrates. The first was in the ancestors of the cartilaginous fish in the form of NAR-TCR (Criscitiello et al. 2006) and the second in the mammals as TCRµ (Parra et al. 2007). NAR-TCR uses an N-terminal V domain related to the V domains found in IgNAR antibodies, which are unique to cartilaginous fish (Greenberg et al. 1995Criscitiello et al. 2006), and not closely related to antibody VH domains. Therefore, it appears that NAR-TCR and TCRµ are more likely the result of convergent evolution rather than being related by direct descent (Parra et al. 2007Wang et al. 2011). Similarly, the model proposed in fig. 5 posits the direct transfer of VH genes from an IgH locus to the TCRα/δ locus. But it should be pointed out the VHδ found in frogs, birds, and monotremes are not closely related (fig. 3); indeed, they appear derived each from different, ancient VH clans (birds, VH clan I; frogs VH clan II; platypus VH clan III). This observation would suggest that the transfer of VHδ into the TCRα/δ loci occurred independently in the different lineages. Alternatively, the transfer of VH genes into the TCRα/δ locus may have occurred frequently and repeatedly in the past and gene replacement is the best explanation for the current content of these genes in the different tetrapod lineages. The absence of VHδ in marsupials, the highly divergent nature of Vµ genes in this lineage, and the absence of conserved synteny with genes linked to TCRµ in the opossum, provide little insight into the origins of TCRµ and its relationship to TCRδ or the other conventional TCR (Parra et al. 2008). The similarity between VH, VHδ, and Vµ genes in the platypus genome, which are all clan III, however is striking. In particular, the close relationship between the platypus VHδ and Vµ genes lends greater support for the model presented in fig. 5E, with TCRµ having been derived from TCRδ genes.

My comments are getting repetitive. This could have been multiple paragraphs etc. etc. It’s easy enough to find the joints where it should be carved, by the way: right before the sentences that start with “Similarly” and “Alternatively” would be a good start, since these words indicate that we’re switching to a new idea.

Fig. 5.
A model of the stages of evolution of the TCRα/δ loci in tetrapods and the origins of TCRµ in mammals. A color key of the gene segments is presented at the bottom. (A) Depiction of the Dδ-Jδ-Cδ duplication in an ancestral TCRα/δ locus that provides a second Cδ gene found in frogs and zebra finch. (B) Depiction of the insertion of a VH gene into the TCRα/δ locus producing a current organization as it is found in zebra finch. (C) Depiction of the inversion/translocation and VHδ gene duplication that yielded the current organization found in frogs. (D) Depiction of the translocation of a VHδ–Dδ–Jδ–Cδ cluster to a location outside the TCRα/δ locus generating a second TCRδ locus as it is currently found in chicken and turkey. (E) Depiction the translocation that took place in mammals giving rise to the TCRµ locus. (F) Loss of TCRµ in placental mammals, loss of D gene segments in cluster encoding the support V domain, retro-transpostion to form a germ-line joined V in marsupials, and duplication of TCRµ clusters in both monotremes and marsupials.

Super helpful figure. Although I’m generally in favor of repeating important info, I do feel that the caption could have simply referred to the 6-point model in the text. The caption as it stands doesn’t add much and looks like a Wall of Text. But that’s not a big deal.

The presence of TCR chains that use antibody like V domains, such as TCRδ using VHδ, NAR-TCR or TCRµ are widely distributed in vertebrates with only the bony fish and placental mammals missing. In addition to NAR-TCR, some shark species also appear to generate TCR chains using antibody V genes. This occurs via trans-locus V(D)J recombination between IgM and IgW heavy chain V genes and TCRδ and TCRα D and J genes (Criscitiello et al. 2010). This may be possible, in part, due to the multiple clusters of Ig genes found in the cartilaginous fish. It also illustrates that there has been independent solutions to generating TCR chains with antibody V domains in different vertebrate lineages. In the tetrapods, the VH genes were trans-located into the TCR loci where they became part of the germ-line repertoire. Whereas in cartilaginous fish something equivalent may occur somatically during V(D)J recombination in developing T cells. Either mechanism suggests there has been selection for having TCR using antibody V genes over much of vertebrate evolutionary history.

The current working hypothesis for such chains is that they are able to bind native antigen directly. This is consistent with a selective pressure for TCR chains that may bind or recognize antigen in ways similar to antibodies in many different lineages of vertebrates. In the case of NAR-TCR and TCRµ, the N-terminal V domain is likely to be unpaired and bind antigen as a single domain (fig. 1), as has been described for IgNAR and some IgG antibodies in camels (recently reviewed in Flajnik et al. 2011). This model of antigen binding is consistent with the evidence that the N-terminal V domains in TCRµ are somatically diverse, while the second, supporting V domains have limited diversity with the latter presumably performing a structural role rather than one of antigen recognition (Parra et al. 2007Wang et al. 2011). There is no evidence of double V domains in TCRδ chains using VHδ in frogs, birds, or platypus (fig. 1) (Parra et al. 20102012). Rather, the TCR complex containing VHδ would likely be structured similar to a conventional γδTCR with a single V domain on each chain. It is possible that such receptors also bind antigen directly, however this remains to be determined.

Not much to add except that I just had a thought that subheadings would have greatly eased this section (like they did the Methods section).

A compelling model for the evolution of the Ig and TCR loci has been one of internal duplication, divergence and deletion; the so-called birth-and-death model of evolution of immune genes promoted by Nei and colleagues (Ota and Nei 1994Nei et al. 1997). Our results in no way contradict that the birth-and-death mode of gene evolution has played a significant role in shaping these complex loci. However, our results do support the role of horizontal transfer of gene segments between the loci that has not been previously appreciated. With this mechanism T cells may have been able to acquire the ability to recognize native, rather than processed antigen, much like B cells.

Pretty good conclusion, opening on new ideas and showing the significance of this work in the field.


Phew. I’m done.

Reading this paper took me several days, although I could have been more focussed in general. But this shows how much work is required to read papers! I had to push myself to read. Many times I caught myself skimming paragraphs without understanding anything, and I had to read again. Right now I think I would benefit from reading it all a second time, but I resist the thought, because it’s work.

But I think it’s a good candidate for my rewriting project. It should be relatively easy to cut down the number of abbreviations, split long paragraphs, and add subheadings. More thorough rewriting will probably involve clarifying the main points and claims right at the start. At the most extreme (I’m not sure I’ll go there), it could be beneficial to change the entire structure: give the detailed model first, and only then explain the background and methods.

Stay tuned!

Categories
original research

Appendix to JAWWS: An Incrementally Rewritten Paragraph

Yesterday, I published a post describing an idea to improve scientific style by rewriting papers as part of a new science journal. I originally wanted to conclude the post with a demonstration of how the rewriting could be done, but I didn’t want to add too much length. Here it is as an appendix.

We start with a paragraph taken more or less at random from a biology paper titled “Shedding light on the ‘dark side’ of phylogenetic comparative methods“, published by Cooper et al. in 2016. Then, in five steps, we’ll incrementally improve it — at least according to my preferences! Let me know if it fits your own idea of good scientific writing as well.

1. Original

Most models of trait evolution are based on the Brownian motion model (Cavalli-Sforza & Edwards 1967; Felsenstein 1973). The Ornstein–Uhlenbeck (OU) model can be thought of as a modification of the Brownian model with an additional parameter that measures the strength of return towards a theoretical optimum shared across a clade or subset of species (Hansen 1997; Butler & King 2004). OU models have become increasingly popular as they tend to fit the data better than Brownian motion models, and have attractive biological interpretations (Cooper et al. 2016b). For example, fit to an OU model has been seen as evidence of evolutionary constraints, stabilising selection, niche conservatism and selective regimes (Wiens et al. 2010; Beaulieu et al. 2012; Christin et al. 2013; Mahler et al. 2013). However, the OU model has several well-known caveats (see Ives & Garland 2010; Boettiger, Coop & Ralph 2012; Hansen & Bartoszek 2012; Ho & Ané 2013, 2014). For example, it is frequently incorrectly favoured over simpler models when using likelihood ratio tests, particularly for small data sets that are commonly used in these analyses (the median number of taxa used for OU studies is 58; Cooper et al. 2016b). Additionally, very small amounts of error in data sets can result in an OU model being favoured over Brownian motion simply because OU can accommodate more variance towards the tips of the phylogeny, rather than due to any interesting biological process (Boettiger, Coop & Ralph 2012; Pennell et al. 2015). Finally, the literature describing the OU model is clear that a simple explanation of clade-wide stabilising selection is unlikely to account for data fitting an OU model (e.g. Hansen 1997; Hansen & Orzack 2005), but users of the model often state that this is the case. Unfortunately, these limitations are rarely taken into account in empirical studies.

Okay, first things first: let’s banish all those horrendous inline citations to footnotes.

2. With footnotes

Most models of trait evolution are based on the Brownian motion model.1Cavalli-Sforza & Edwards 1967; Felsenstein 1973 The Ornstein–Uhlenbeck (OU) model can be thought of as a modification of the Brownian model with an additional parameter that measures the strength of return towards a theoretical optimum shared across a clade or subset of species.2Hansen 1997; Butler & King 2004 OU models have become increasingly popular as they tend to fit the data better than Brownian motion models, and have attractive biological interpretations.3Cooper et al. 2016b For example, fit to an OU model has been seen as evidence of evolutionary constraints, stabilising selection, niche conservatism and selective regimes.4Wiens et al. 2010; Beaulieu et al. 2012; Christin et al. 2013; Mahler et al. 2013 However, the OU model has several well-known caveats.5see Ives & Garland 2010; Boettiger, Coop & Ralph 2012; Hansen & Bartoszek 2012; Ho & Ané 2013, 2014 For example, it is frequently incorrectly favoured over simpler models when using likelihood ratio tests, particularly for small data sets that are commonly used in these analyses.6the median number of taxa used for OU studies is 58; Cooper et al. 2016b Additionally, very small amounts of error in data sets can result in an OU model being favoured over Brownian motion simply because OU can accommodate more variance towards the tips of the phylogeny, rather than due to any interesting biological process.7Boettiger, Coop & Ralph 2012; Pennell et al. 2015 Finally, the literature describing the OU model is clear that a simple explanation of clade-wide stabilising selection is unlikely to account for data fitting an OU model,8e.g. Hansen 1997; Hansen & Orzack 2005 but users of the model often state that this is the case. Unfortunately, these limitations are rarely taken into account in empirical studies.

Much better.

Does this need to be a single paragraph? No, it doesn’t. Let’s not go overboard with cutting it up, but I think a three-fold division makes sense.

3. Multiple paragraphs

Most models of trait evolution are based on the Brownian motion model.9Cavalli-Sforza & Edwards 1967; Felsenstein 1973

The Ornstein–Uhlenbeck (OU) model can be thought of as a modification of the Brownian model with an additional parameter that measures the strength of return towards a theoretical optimum shared across a clade or subset of species.10Hansen 1997; Butler & King 2004 OU models have become increasingly popular as they tend to fit the data better than Brownian motion models, and have attractive biological interpretations.11Cooper et al. 2016b For example, fit to an OU model has been seen as evidence of evolutionary constraints, stabilising selection, niche conservatism and selective regimes.12Wiens et al. 2010; Beaulieu et al. 2012; Christin et al. 2013; Mahler et al. 2013

However, the OU model has several well-known caveats.13see Ives & Garland 2010; Boettiger, Coop & Ralph 2012; Hansen & Bartoszek 2012; Ho & Ané 2013, 2014 For example, it is frequently incorrectly favoured over simpler models when using likelihood ratio tests, particularly for small data sets that are commonly used in these analyses.14the median number of taxa used for OU studies is 58; Cooper et al. 2016b Additionally, very small amounts of error in data sets can result in an OU model being favoured over Brownian motion simply because OU can accommodate more variance towards the tips of the phylogeny, rather than due to any interesting biological process.15Boettiger, Coop & Ralph 2012; Pennell et al. 2015 Finally, the literature describing the OU model is clear that a simple explanation of clade-wide stabilising selection is unlikely to account for data fitting an OU model,16e.g. Hansen 1997; Hansen & Orzack 2005 but users of the model often state that this is the case. Unfortunately, these limitations are rarely taken into account in empirical studies.

We haven’t rewritten anything yet — the changes so far are really low-hanging fruit! Let’s see if we can improve the text more with some rephrasing. This is trickier, because there’s a risk I change the original meaning, but it’s not impossible.

4. Some rephrasing

Most models of trait evolution are based on the Brownian motion model, in which traits evolve randomly and accrue variance over time.17Cavalli-Sforza & Edwards 1967; Felsenstein 1973

What if we add a parameter to measure how much the trait motion returns to a theoretical optimum for a given clade or set of species? Then we get a family of models called Ornstein-Uhlenbeck,18Hansen 1997; Butler & King 2004 first developed as a way to describe friction in the Brownian motion of a particle. These models have become increasingly popular, both because they tend to fit the data better than simple Brownian motion, and because they have attractive biological interpretations.19Cooper et al. 2016b For example, fit to an Ornstein-Uhlenbeck model has been seen as evidence of evolutionary constraints, stabilising selection, niche conservatism and selective regimes.20Wiens et al. 2010; Beaulieu et al. 2012; Christin et al. 2013; Mahler et al. 2013

However, Ornstein-Uhlenbeck models have several well-known caveats.21see Ives & Garland 2010; Boettiger, Coop & Ralph 2012; Hansen & Bartoszek 2012; Ho & Ané 2013, 2014 For example, they are frequently — and incorrectly — favoured over simpler Brownian models. This occurs with likelihood ratio tests, particularly for the small data sets that are commonly used in these analyses.22the median number of taxa used for Ornstein-Uhlenbeck studies is 58; Cooper et al. 2016b It also happens when there is error in the data set, even very small amounts of error, simply because Ornstein-Uhlenbeck models accommodate more variance towards the tips of the phylogeny — therefore suggesting an interesting biological process where there is none.23Boettiger, Coop & Ralph 2012; Pennell et al. 2015 Additionally, users of Ornstein-Uhlenbeck models often state that clade-wide stabilising selection accounts for data fitting the model, even though the literature describing the model warns that such a simple explanation is unlikely.24e.g. Hansen 1997; Hansen & Orzack 2005 Unfortunately, these limitations are rarely taken into account in empirical studies.

What did I do here? First, I completely got rid of the “OU” acronym. Acronyms may look like they simplify the writing, but in fact they often ask more cognitive resources from the reader, who has to constantly remember that OU means Ornstein-Uhlenbeck.

Then I rephrased several sentences to make them flow better, at least according to my taste.

I also added a short explanation of what Brownian and Ornstein-Uhlenbeck models are. That might not be necessary, but it’s always good to make life easier for the reader. Even if you defined the terms earlier in the paper, repetition is useful to avoid asking the reader an effort to remember. And even if everyone reading your paper is expected to know what Brownian motion is, there’ll be some student somewhere thanking you for reminding them.25I considered doing this with the “evolutionary constraints, stabilising selection, niche conservatism and selective regimes” enumeration too, but these are mere examples, less critical to the main idea of the section. Adding definitions would make the sentence quite long and detract from the main flow. Also I don’t know what the definitions are and don’t feel like researching lol.

This is already pretty good, and still close enough to the original. What if I try to go further?

5. More rephrasing

Most models of trait evolution are based on the Brownian motion model.26Cavalli-Sforza & Edwards 1967; Felsenstein 1973 Brownian motion was originally used to describe the random movement of a particle through space. In the context of trait evolution, it assumes that a trait (say, beak size in some group of bird species) changes randomly, with some species evolving a larger beak, some a smaller one, and so on. Brownian motion implies that variance in beak size, across the group of species, increases over time.

This is a very simple model. What if we refined it by adding a parameter? Suppose there is a theoretical optimal beak size for this group of species. The new parameter measures how much the trait tends to return to this optimum. This gives us a type of model called Ornstein-Uhlenbeck,27Hansen 1997; Butler & King 2004 first developed as a way to add friction to the Brownian motion of a particle.

Ornstein-Uhlenbeck models have become increasingly popular in trait evolution, for two reasons.28Cooper et al. 2016b First, they tend to fit the data better than simple Brownian motion. Second, they have attractive biological interpretations. For example, fit to an Ornstein-Uhlenbeck model has been seen as evidence of a number of processes, including evolutionary constraints, stabilising selection, niche conservatism and selective regimes.29Wiens et al. 2010; Beaulieu et al. 2012; Christin et al. 2013; Mahler et al. 2013

Despite this, Ornstein-Uhlenbeck models are not perfect, and have several well-known caveats.30see Ives & Garland 2010; Boettiger, Coop & Ralph 2012; Hansen & Bartoszek 2012; Ho & Ané 2013, 2014 Sometimes you really should use a simpler model! It is common, but incorrect, to favour an Ornstein-Uhlenbeck model over a Brownian model after performing likelihood ratio tests, particularly for the small data sets that are often used in these analyses.31the median number of taxa used for Ornstein-Uhlenbeck studies is 58; Cooper et al. 2016b Then there is the issue of error in data sets. Even a very small amount of error can lead researchers to pick an Ornstein-Uhlenbeck model, simply because they accommodate more variance towards the tips of the phylogeny — therefore suggesting interesting biological processes where there is none.32Boettiger, Coop & Ralph 2012; Pennell et al. 2015

Additionally, users of Ornstein-Uhlenbeck models often state that the reason their data fits the model is clade-wide stabilising selection (for instance, selection for intermediate beak sizes, rather than extreme ones, across the group of birds). Yet the literature describing the model warns that such simple explanations are unlikely.33e.g. Hansen 1997; Hansen & Orzack 2005

Unfortunately, these limitations are rarely taken into account in empirical studies.

Okay, many things to notice here. First, I added an example, bird beak size. I’m not 100% sure I understand the topic well enough for my example to be particularly good, but I think it’s decent. I also added more explanation of what Brownian models are in trait evolution. Then I rephrased other sentences to make the tone less formal.

As a result, this version is longer than the previous ones. It seemed justified to cut it up into more paragraphs to accommodate the extra length. It’s plausible that the authors originally tried to include too much content in too few words, perhaps to satisfy a length constraint posed by the journal.

Let’s do one more round…

6. Rephrasing, extreme edition

Suppose you want to model the evolution of beak size in some fictional family of birds. There are 20 bird species in the family, all with different average beak sizes. You want to create a model of how their beaks changed over time, so you can reimagine the beak of the family’s ancestor and understand what happened exactly.

Most people who try to model the evolution of a biological trait use some sort of Brownian motion model.34Cavalli-Sforza & Edwards 1967; Felsenstein 1973 Brownian motion, originally, refers to the random movement of a particle in a liquid or gas. The mathematical analogy here is that beak size evolves randomly: it becomes very large in some species, very small in others, with various degrees of intermediate forms between the extremes. Therefore, across the 20 species, the variance in beak size increases over time.

Brownian motion is a very simple model. What if we add a parameter to get a slightly more complicated one? Let’s assume there’s a theoretical optimal beak size for our family of birds — maybe because the seeds they eat have a constant average diameter. The new parameter measures how much beak size tends to return to the optimum during its evolution. This gives us a type of model called Ornstein-Uhlenbeck,35Hansen 1997; Butler & King 2004 first developed as a way to add friction to the Brownian motion of a particle. We can imagine the “friction” to be the resistance against deviating from the optimum.

Ornstein-Uhlenbeck models have become increasingly popular, for two reasons.36Cooper et al. 2016b First, they often fit real-life data better than simple Brownian motion. Second, they are easy to interpret biologically. For example, maybe our birds don’t have as extreme beak sizes as we’d expect from a Brownian model, so it makes sense to assume there’s some force pulling the trait towards an intermediate optimum. That force might be an evolutionary constraint, stabilising selection (i.e. selection against extremes), niche conservatism (the tendency to keep ancestral traits), or selective regimes. Studies using Ornstein-Uhlenbeck models have been seen as evidence for each of these patterns.37Wiens et al. 2010; Beaulieu et al. 2012; Christin et al. 2013; Mahler et al. 2013

Of course, Ornstein-Uhlenbeck aren’t perfect, and in fact have several well-known caveats.38see Ives & Garland 2010; Boettiger, Coop & Ralph 2012; Hansen & Bartoszek 2012; Ho & Ané 2013, 2014 For example, simpler models are sometimes better. It’s common for researchers to incorrectly choose Ornstein-Uhlenbeck instead of Brownian motion when using likelihood ratio tests to compare models, a problem especially present due to the small data sets that are often used in these analyses.39the median number of taxa used for Ornstein-Uhlenbeck studies is 58; Cooper et al. 2016b Then there is the issue of error in data sets (e.g. when your beak size data isn’t fully accurate). Even a very small amount of error can lead researchers to pick an Ornstein-Uhlenbeck model, simply because it’s better at accommodating variance among closely related species at the tips of a phylogenetic tree. This can suggest interesting biological processes where there are none.40Boettiger, Coop & Ralph 2012; Pennell et al. 2015

One particular mistake that users of Ornstein-Uhlenbeck models often make is to assume that their data fits the model due to clade-wise stabilising selection (e.g. selection for intermediate beak sizes, rather than extreme ones, across the family of birds). Yet the literature warns against exactly that — according to the papers describing the models, such simple explanations are unlikely.41e.g. Hansen 1997; Hansen & Orzack 2005

Unfortunately, these limitations are rarely taken into account in empirical studies.

This is longer still than the previous version! At this point I’m convinced the original paragraph was artificially short. That is, it packed far more information than a text of its size normally should.

This is a common problem in science writing. Whenever you write something, there’s a tradeoff between brevity, clarity, amount of information, and complexity: you can only maximize three of them. Since science papers often deal with a lot of complex information, and have word limits, clarity often gets the short end of the stick.

Version 6 is a good example of sacrificing brevity to get more clarity. In this case it’s important to keep the amount of information constant, because I don’t want to change what the original authors were saying. It is possible that they were saying too many things. On the other hand, this is only one paragraph in a longer paper, so maybe it made sense to simply mention some ideas without developing them.

I tried a Version 7 in which I aimed for a shorter paragraph, on the scale of the original one, but I failed. To be able to keep all the information, I would have to sacrifice the extra explanations and the bird beak example, and we’d be back to square one. This suggests that both the original paragraph and my rewritten version are on different points on the tradeoff curve. The original is brief, information-rich, and complex dense; my version is information-rich, complex, and clear.. To get brief and clear would require taking some information out, which I can’t do as a rewriter.

It is my opinion that sacrificing clarity is the worst possible world, at least in most contexts. We could then rephrase my project as attempting to emphasize clarity above all else — after all, brevity, information richness and complexity serve no purpose if they fail to communicate what they want to.

Categories
original research

Of Emoji and Hieroglyphs

Emoji are pictograms that are used to add nuance and meaning to electronic written text. They were invented in Japan in the 1990s and are now widely used across the world. Random examples: 🤾‍♂️ 😒 🦑 🔊 💚

Egyptian hieroglyphs are characters, mostly based on real objects, that were used to write the Ancient Egyptian language. They were invented around the 32nd century BC and fell into disuse by Late Antiquity. Random examples:1If you only see squares, that means you need to install a font that supports those Unicode characters. Most browsers will display them automatically, but I’m not sure about the details. 𓊛 𓋊 𓃕 𓌗 𓎁

There’s an obvious parallel to be drawn between the two, which multiple people have pointed out, usually with cries of “Thousands of years of language evolution and we’re back to using pictograms!” Even I tweeted about a few months ago:

As Twitter threads go, this was a reasonably popular one, which means there was some value in investigating the links between emoji and hieroglyphs. But maybe not enough to write more than a few tweets, and so the matter was put to rest.

Then I read Clo’s excellent piece on emoji and our relationship with them, and it made me want to revisit the topic. So I embarked on a small and silly side project.

The result is being released today. It is a browser extension. It is called Emoji to Hieroglyphs. It replaces the former with the latter whenever possible as you browse the web. It’s stupid and fun. And it can be downloaded here.

How it works

Emoji to Hieroglyphs is based on the famous cloud-to-butt extension — which replaces “the cloud” with “your butt” all over the internet — because I don’t really know any JavaScript so it was simpler to steal code from somewhere. Good thing that cloud-to-butt is released under the “Do What The F*ck You Want To Public License”, which I’m also using for Emoji to Hieroglyphs.

The extension searches text in web pages for certain emoji, and replaces them with the closest hieroglyphic visual equivalent I could find. Here are some examples:

🤸 → 𓀡

✍️ → 𓃈

🐇 → 𓃹

⛵ → 𓊝

(Of course, the extension needs to be uninstalled for these examples to make sense.)

Not all emoji have a hieroglyphic equivalent. As of today, there are 3,521 emoji in Unicode 13.1, but only 1,071 hieroglyphs. A lot of the extra emoji are things that didn’t exist in Ancient Egypt, such as soccer ⚽, helicopters 🚁, Japan 🗾, or jack-o-lanterns 🎃. Many others represent something that did exist along the banks of the Nile, but that the Egyptians didn’t bother making a hieroglyph for, e.g. skulls 💀, grapes 🍇, or crabs 🦀. I assume the Ancient Egyptians had emotions, but there aren’t any hieroglyphs to represent them directly, so smileys such as 😄, 😍, 🤯, or 🤑 are also not affected by my extension.

Not all hieroglyphs have an emoji equivalent, either. Many are just too abstract, like 𓊖, which is supposed to mean “village.” Several others are combinations, like 𓆲, combining an owl and a branch; I could’ve used it to replace 🪵🦉 and 🦉🪵, and indeed I did this for a few combos, but usually that’s just not very interesting. A few hieroglyphs represent things that the Unicode Consortium has prudishly decided not to depict as emoji, such as breasts or phalluses.2Ancient Egyptian has three hieroglyphs for the penis: 𓂸, 𓂹 (phallus combined with cloth), and 𓂺 (phallus with emission). I considered replacing the eggplant emoji 🍆 with 𓂸, but then I decided it’d be confusing and offensive for people using it as, uh, an actual eggplant. And a lot are just too specific to Ancient Egypt. For instance, there are regrettably not yet emoji for “pyramid,”3although I used it to replace the Tokyo Tower emoji 🗼, because why not “mummy-shaped god,” “crocodile on shrine,” or “human-headed bird with bowl with smoke.”

𓉴 𓁰 𓆋 𓅽

Maybe in Unicode 14.

I did manage to create more than 300 mappings, not counting all the skin tone and gender emoji variations, which I have for the most part merged together. Everyone is an Egyptian in my extension! Also, almost everyone is male, because there are only a few specifically female hieroglyphs, usually related to pregnancy or child rearing. Don’t blame me, blame the Ancients.

The most affected emoji categories are people (except smileys), animals, plants, and a bunch of random objects such as containers or bread-like foods.

Here’s a screenshot from Emojipedia’s list of people emoji, modified with the extension:

I should note that I created mappings only based on the visual appearance of the symbols. The word “doctor” in Ancient Egyptian is written with three glyphs, 𓌕𓏌𓀃,4The arrow should be above the pot, but I can’t do that in linear text. but I didn’t map the emoji 🧑‍⚕️ to that combination since it wouldn’t be very evocative. Such a mapping would be more akin to a translation, which isn’t the goal here.

On the other hand, not all visual mappings are as obvious as 🐘 to 𓃰. Consider 𓆳, which is supposed to be a palm branch. Since there is no palm tree hieroglyph, I used the palm branch to replace the palm tree emoji.

🌴 → 𓆳

The link may not be crystal clear to users, but I included it anyway in the interest of having as many mappings as possible. Here are a few other examples where the emoji and hieroglyphs do represent the same object, but where the resemblance isn’t that strong:

🔥 → 𓊮

🏠 → 𓉐

💩 → 𓄽

Conversely, some mappings are just based on superficial resemblance. The sistrum is an ancient percussion instrument which, as you can imagine, doesn’t have a close emoji equivalent. But since it’s about music and sort of resembles a microphone, that’s what I decided to use it for. There are also “woman holding sistrum” and “man holding sistrum” hieroglyphs, so it made sense to replace the female and male singer emoji with those.

🎤 → 𓏣

👩‍🎤 → 𓁙

👨‍🎤 → 𓁋

Finally, not all mappings are 1:1. Sometimes multiple emoji together make a single hieroglyph.

🌊 → 𓈖

🌊🌊🌊 → 𓈗

And sometimes a single emoji is expressed through multiple hieroglyphs.

🏡 → 𓆭𓉐

👀 → 𓁹𓁹

There are a few combinations that could be considered Easter eggs. I will not tell you which.

Overall, don’t expect a lot of consistency. This is obviously just for fun, and I hope some of you do have fun with it. I had fun making it; I even learned a few things! Which we’ll get into presently.

Some linguistics

To some, emoji mark a return to a more primitive form of language. We started out with cave paintings, then we developed pictograms (character = picture), then we got more general logograms (character = word), and then we gradually invented more symbolic forms of writing, culminating in clean5alphabets aren’t actually clean, they’re super redundant and inconsistent, but let’s allow this for the sake of the argument phonetic alphabets with a few dozen characters.6At least in the West. Chinese has remained at the logogram stage, and there aren’t any strong reasons to think it’s inferior to alphabetic writing. This should make us dubious of claims that the evolution of written language has followed any sort of natural progress. And now, with the advent of mind-numbing technology such as smartphones and Twitter, we’re apparently back to pictograms.

Thus joke images such as:

and:

and:

(Two notes about this last image: first, those mappings are terrible, and second, the image on the left isn’t even a picture of actual hieroglyphs. There isn’t a hieroglyph that looks like “#”. I don’t know where it’s from, but it’s very fake.)

Many media pieces discuss the question, and they all converge on the same point: No, emoji and hieroglyphs are not the same thing. Hieroglyphs weren’t just cute drawings to decorate Egyptian temples! They were a full-fledged writing system! A single hieroglyph, say the wigeon duck, 𓅰, could be used to represent an actual wigeon, yes, but it could also represent the idea of food, or the verb “to fatten,” and it had full phonetic value just like our letters, being used to transcribe the consonant sounds wšꜣ!7The symbol “ꜣ”, if you’re curious, represents the conventional transcription of the letter aleph in Egyptology, indicating something like a glottal stop.

Whereas emoji aren’t a writing system. They are mostly cute drawings we use to decorate our sentences. They carry meaning, and are linguistically interesting, but you can’t express arbitrary sentences with them, at least not at the moment.

Perhaps, like hieroglyphs, emoji could one day represent sounds directly. Say 🥶 = “fr”, 😇 = “en”, and 🍩 = “d”. Then 🥶😇🍩 could be used to represent the spoken word “friend,” even though the symbols have mostly nothing to do with friends. Add a ship, 🛳, and now we get a hybrid word, combining phonograms and logograms: 🥶😇🍩🛳, “friendship.” But we’re unlikely to get there, because, well, we already have symbols to represent sounds. The 26 letters of the English version of the Latin alphabet, for example. Or the > 160 symbols of the International Phonetic Alphabet, if you want more comprehensiveness. The reason the Egyptians gave phonetic value to their cute little drawings is that they were all they had.

But I want to go in a somewhat different direction than both the joke images and the serious linguistics articles.

I claim that we never actually stopped using Ancient Egyptian hieroglyphs. I claim that we’re still at the stage of using cute little drawings to represent language.

Consider the letter A, the first in the Latin alphabet. Where does it come from? The Latin alphabet is descended from the Greek one, by way of the Etruscan alphabet. So the letter A comes from the Greek equivalent, Α/α, pronounced “alpha.” But where did alpha come from?

It came from the Phoenician alphabet, whose immediate ancestor is the Proto-Sinaitic script, considered the first alphabet in the world. The Phoenicians were a coastal people of the Levant in Antiquity. Their invention of the alphabet turned out to be quite influential, since the vast majority of the world today writes in systems descended from it: Latin and Greek, but also Cyrillic (used to write Russian, among others), Arabic, Hebrew, Ge’ez (used for Ethiopian), all of the scripts used in India and Southeast Asia, and even Mongolian. In other words, pretty much everything on this map except China, Korea, Japan, possibly Georgia and the syllabary used for indigenous languages in northern Canada.8gray = Latin, teal = Cyrillic, green = Arabic, see the original source for others

Writing systems worldwide.png

The equivalent to A and alpha in Phoenician is 𐤀, pronounced “aleph.” It has an equivalent in all those other scripts, such as Hebrew א (also called aleph). Okay. But where did aleph come from?

At this point we’re quite far out in the past, with the Proto-Sinaitic script having been in use from the 19th to the 15th centuries BC, so things get a bit murky. But the land of Canaan, where the script was used, is right next to Egypt. And 𐤀 kind of looks like a stylized ox head. So does A, for that matter, except upside down. Look at the math symbol ∀ (“for all”). Pretty easy to see an animal head with horns, right? And so it is commonly accepted that the letter A is descended from the Egyptian hieroglyph 𓃾.9Below, 𐌀 is the Etruscan or old Italic version. I’m not showing Greek Α/α because it would have to go between 𐤀 and 𐌀, but it looks more similar to A than to 𐌀. This is because the actual Greek letter that led to the Etruscan version was an archaic version that is not in Unicode. For more details and more intermediate forms, see Wikipedia on the history of A.

𓃾 → 𐤀 → 𐌀 → A/a

Yes. Each time you use the symbol A or a, which, if you write at all, probably happens dozens or hundreds of times a day, you are in fact using something that ultimately comes from the Ancient Egyptian version of “🐮”.

And all of our letters are like this! (With one exception.) Some are a bit obscure, like B, which apparently comes from the house hieroglyph:

𓉐  𐤁 → 𐌁 → B/b

But most others are pretty clear.

𓈖 → 𐤌 → 𐌌 → M/m

𓆓 → 𐤍 → 𐌍 → N/n

𓁹 → 𐤏 → 𐌏 → O/o

(And then, of course, the O became the many-eyed or multiocular O, whose Unicode version is “ꙮ”, in one hilarious and terrifying instance of a monk doodling something in his copy of the Orthodox Christian Bible.)

Here’s the full Latin emoji alphabet based on the hieroglyphic origins of the letters. Hang a version in your toddler’s bedroom, to thoroughly confuse him or her!10You can notice the exception: the letter X comes from Greek Χχ (chi), but chi was apparently a native Greek invention and wasn’t derived from Phoenician or Egyptian hieroglyphs. So I left it as is.

🐮🏠🏒🐠🤷🥄🏒🚧💪💪🤚🦯🌊🐍👁👄🐒🗣️🏹❌🥄🥄🥄X🥄🥢

𓃾𓉐𓌙𓆛𓀠𓌉𓌙𓊐𓂝𓂝𓂧𓋿𓈖𓆓𓁹𓂋𓃻𓁶𓌓𓏴𓌉𓌉𓌉X𓌉𓏭

ABCDEFGHIJKLMNOPQRSTUVWXYZ

Maybe next time I’ll create an extension to turn all Latin letters into hieroglyphs or emoji. Just to confuse everyone.

To conclude, emoji aren’t a return to anything. We’re still using symbols based on real objects, even if most of them aren’t recognizable anymore. Our system is a bit more advanced than the Egyptians’ — for one thing, we have vowels, they didn’t — but it isn’t fundamentally any different.

Of course, emoji do fulfill some needs — otherwise we wouldn’t use them. They are recognizable as objects and ideas, unlike our letters. They’re diverse. They’re fun. Maybe a good, complete writing system should feature small pictures to convey emotion, nuance, and humor. In a way, the Egyptians had a bit of that. Now we do too, thanks to emoji.

I would say it is a good development.

✨ Download the Emoji to Hieroglyphs extension here ✨